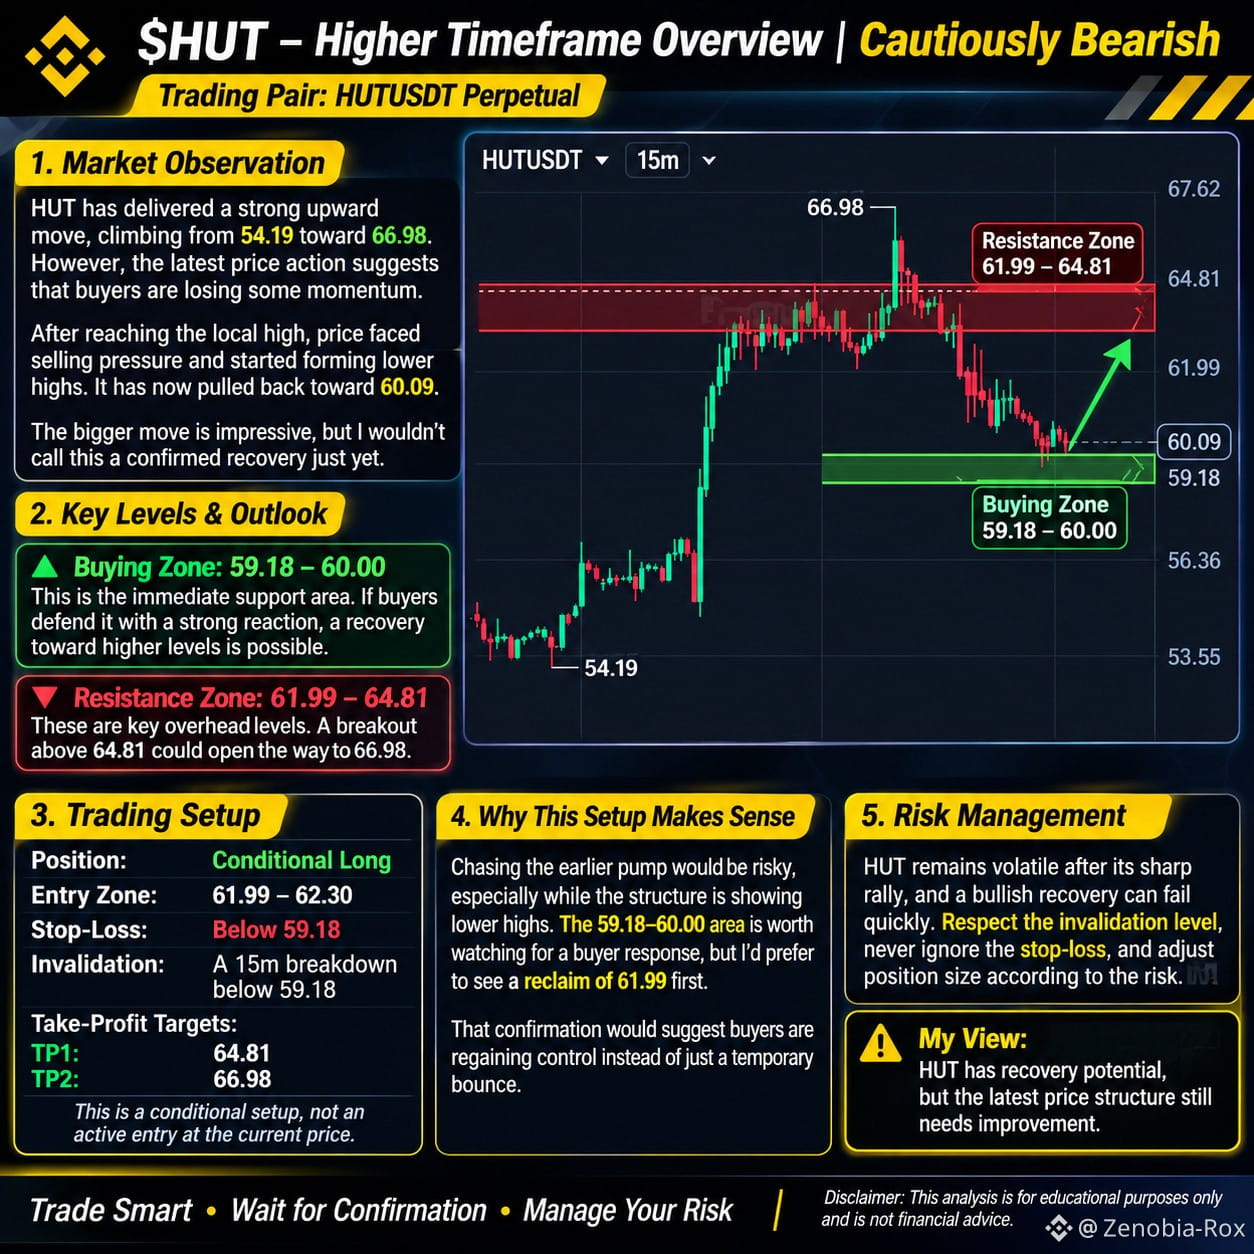

$HUT – Higher Timeframe Overview | Cautiously Bearish
Trading Pair: HUTUSDT Perpetual
Current Price: 60.09 USDT 24H Change: +9.31% 24H High: 66.98 24H Low: 54.19 Chart Timeframe: 15M
### 1\. Natural Market Observation
HUT has delivered a strong upward move, climbing from the 54.19 region toward 66.98. However, the latest price action suggests that buyers are losing some momentum.
After reaching the local high, price faced clear selling pressure and started forming lower highs and lower lows. It has now pulled back toward 60.09.
The bigger intraday move is still impressive, but I wouldn't call this a confirmed recovery just yet. The market needs to show that buyers can defend support and reclaim important resistance levels.
### 2\. Current Outlook and Key Levels
Buying Zone: 59.18 – 60.00
This is the immediate support area worth monitoring. Price is approaching the 59.18 level after a series of lower highs.
If buyers defend this region and produce a convincing bullish reaction, a recovery toward the previous resistance levels becomes possible.
However, a support touch alone is not a buy signal. I would prefer to see a strong 15-minute recovery candle and follow-through.
Resistance Zone: 61.99 – 64.81
This is the important overhead supply area.
The 61.99 region represents the first meaningful recovery hurdle, while 64.81 is a stronger resistance reference from the recent price structure.
A sustained reclaim above 61.99 would improve the short-term outlook. A breakout and consolidation above 64.81 could open the way toward the previous high of 66.98.
### 3\. Trading Setup
Position: Conditional Long – Only After Confirmation
Entry Zone: 61.99 – 62.30 (after a confirmed reclaim and successful retest)
Stop-Loss: Below 59.18
Invalidation: A decisive 15-minute breakdown below 59.18 would invalidate the bullish recovery setup and increase the risk of further downside.
Take-Profit Targets:
* TP1: 64.81
* TP2: 66.98
* TP3: No additional target confirmed by the supplied chart.
Trading Pair: HUTUSDT Perpetual
Current Price: 60.09 USDT 24H Change: +9.31% 24H High: 66.98 24H Low: 54.19 Chart Timeframe: 15M
### 1\. Natural Market Observation
HUT has delivered a strong upward move, climbing from the 54.19 region toward 66.98. However, the latest price action suggests that buyers are losing some momentum.
After reaching the local high, price faced clear selling pressure and started forming lower highs and lower lows. It has now pulled back toward 60.09.
The bigger intraday move is still impressive, but I wouldn't call this a confirmed recovery just yet. The market needs to show that buyers can defend support and reclaim important resistance levels.
### 2\. Current Outlook and Key Levels
Buying Zone: 59.18 – 60.00
This is the immediate support area worth monitoring. Price is approaching the 59.18 level after a series of lower highs.
If buyers defend this region and produce a convincing bullish reaction, a recovery toward the previous resistance levels becomes possible.
However, a support touch alone is not a buy signal. I would prefer to see a strong 15-minute recovery candle and follow-through.
Resistance Zone: 61.99 – 64.81
This is the important overhead supply area.
The 61.99 region represents the first meaningful recovery hurdle, while 64.81 is a stronger resistance reference from the recent price structure.
A sustained reclaim above 61.99 would improve the short-term outlook. A breakout and consolidation above 64.81 could open the way toward the previous high of 66.98.
### 3\. Trading Setup
Position: Conditional Long – Only After Confirmation
Entry Zone: 61.99 – 62.30 (after a confirmed reclaim and successful retest)
Stop-Loss: Below 59.18
Invalidation: A decisive 15-minute breakdown below 59.18 would invalidate the bullish recovery setup and increase the risk of further downside.
Take-Profit Targets:
* TP1: 64.81
* TP2: 66.98
* TP3: No additional target confirmed by the supplied chart.