🟡 BCHUSDT | Binance Daily Candle Analysis🪙
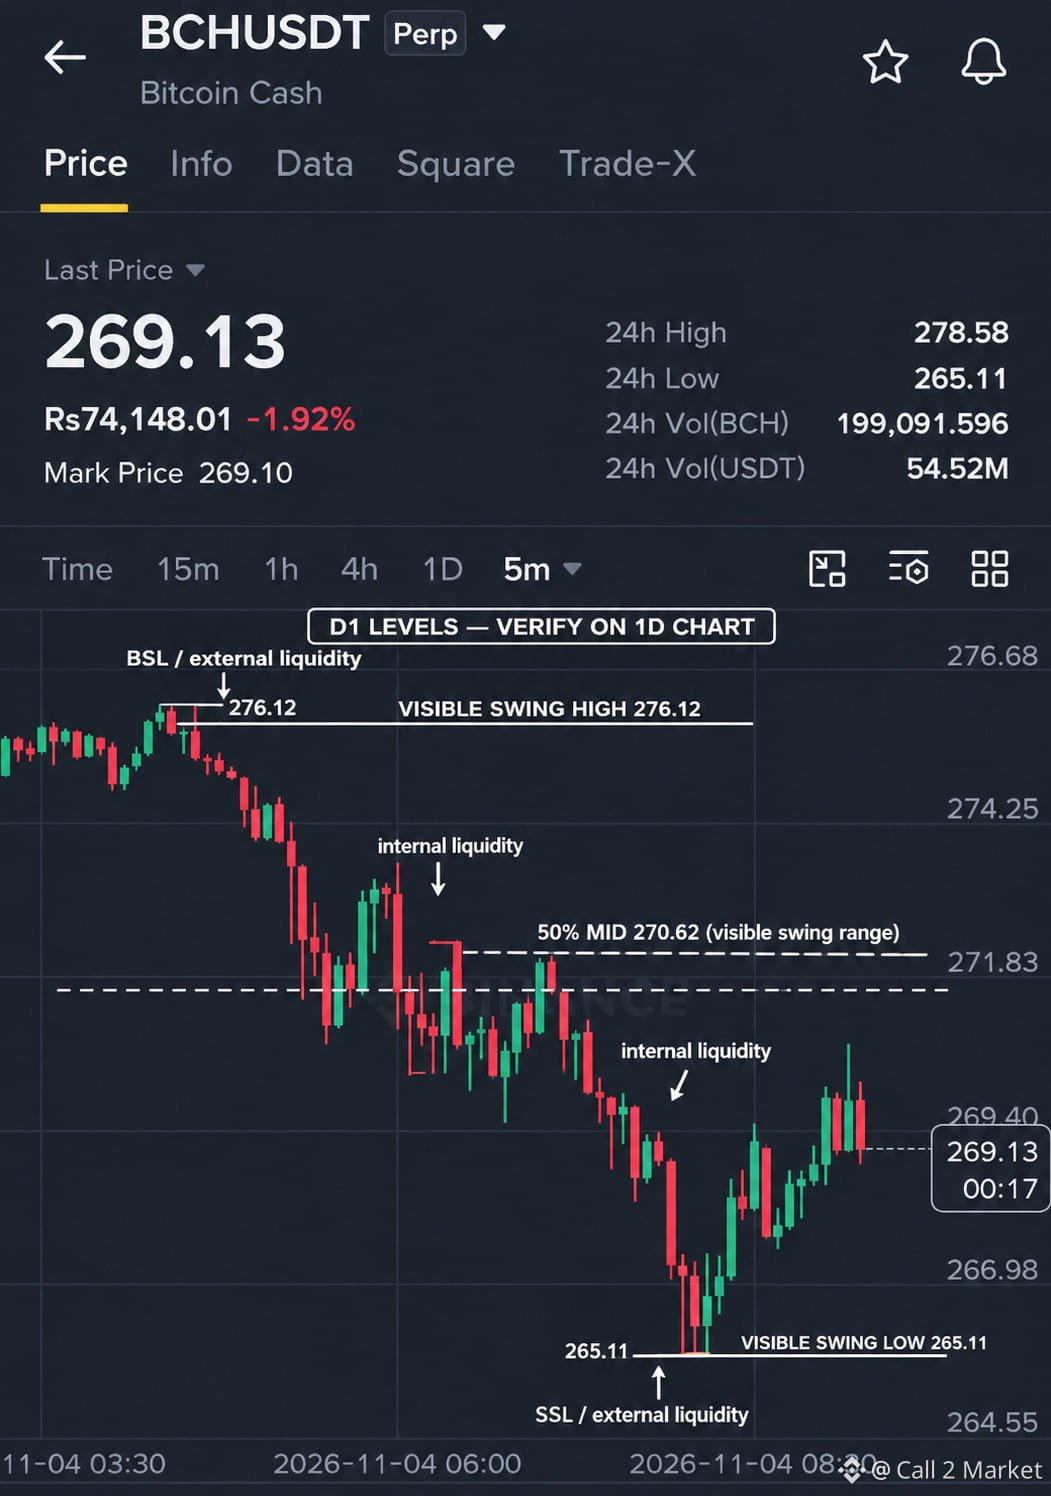
Today’s analysis focuses exclusively on the previous Daily candle using C2M-based Candle Range Theory (CRT).
📊 Chart Markings:
1. Previous Daily Candle High: 278.70 USDT
2. Previous Daily Candle Low:273.00 USDT
3. 50% Equilibrium:275.85 USDT
🔹External Liquidity (EQL):
The liquidity resting above the previous candle high and below its low is marked as External Liquidity. These levels are important areas to monitor for potential liquidity sweeps.
🔹 Internal Liquidity (IQL):
The liquidity resting inside the previous daily candle range is identified as Internal Liquidity. Watch how price reacts around these internal levels.
🔹 50% Equilibrium:
The midpoint divides the previous candle into Premium and Discount zones. Above 50% is Premium, while below 50% is Discount.
🎯 Trading Perspective:
The main objective is to observe how the current candle interacts with the previous candle's high, low, and 50% equilibrium. A liquidity sweep followed by a clear reaction can provide valuable information about potential market direction.
No unnecessary indicators, no extra drawings — only clean Daily CRT analysis.
⚠️ Educational analysis only, not financial advice.
#Binance #BCHUSDT #C2M #DailyAnalysis #Call2Market
$BCH
Today’s analysis focuses exclusively on the previous Daily candle using C2M-based Candle Range Theory (CRT).
📊 Chart Markings:
1. Previous Daily Candle High: 278.70 USDT
2. Previous Daily Candle Low:273.00 USDT
3. 50% Equilibrium:275.85 USDT
🔹External Liquidity (EQL):
The liquidity resting above the previous candle high and below its low is marked as External Liquidity. These levels are important areas to monitor for potential liquidity sweeps.
🔹 Internal Liquidity (IQL):
The liquidity resting inside the previous daily candle range is identified as Internal Liquidity. Watch how price reacts around these internal levels.
🔹 50% Equilibrium:
The midpoint divides the previous candle into Premium and Discount zones. Above 50% is Premium, while below 50% is Discount.
🎯 Trading Perspective:
The main objective is to observe how the current candle interacts with the previous candle's high, low, and 50% equilibrium. A liquidity sweep followed by a clear reaction can provide valuable information about potential market direction.
No unnecessary indicators, no extra drawings — only clean Daily CRT analysis.
⚠️ Educational analysis only, not financial advice.
#Binance #BCHUSDT #C2M #DailyAnalysis #Call2Market
$BCH