$DOGE: DOGE Volume Myth: Does a Big Candle Guarantee a Move?
**Myth**: A loud candle on the hourly chart means the price will keep falling.
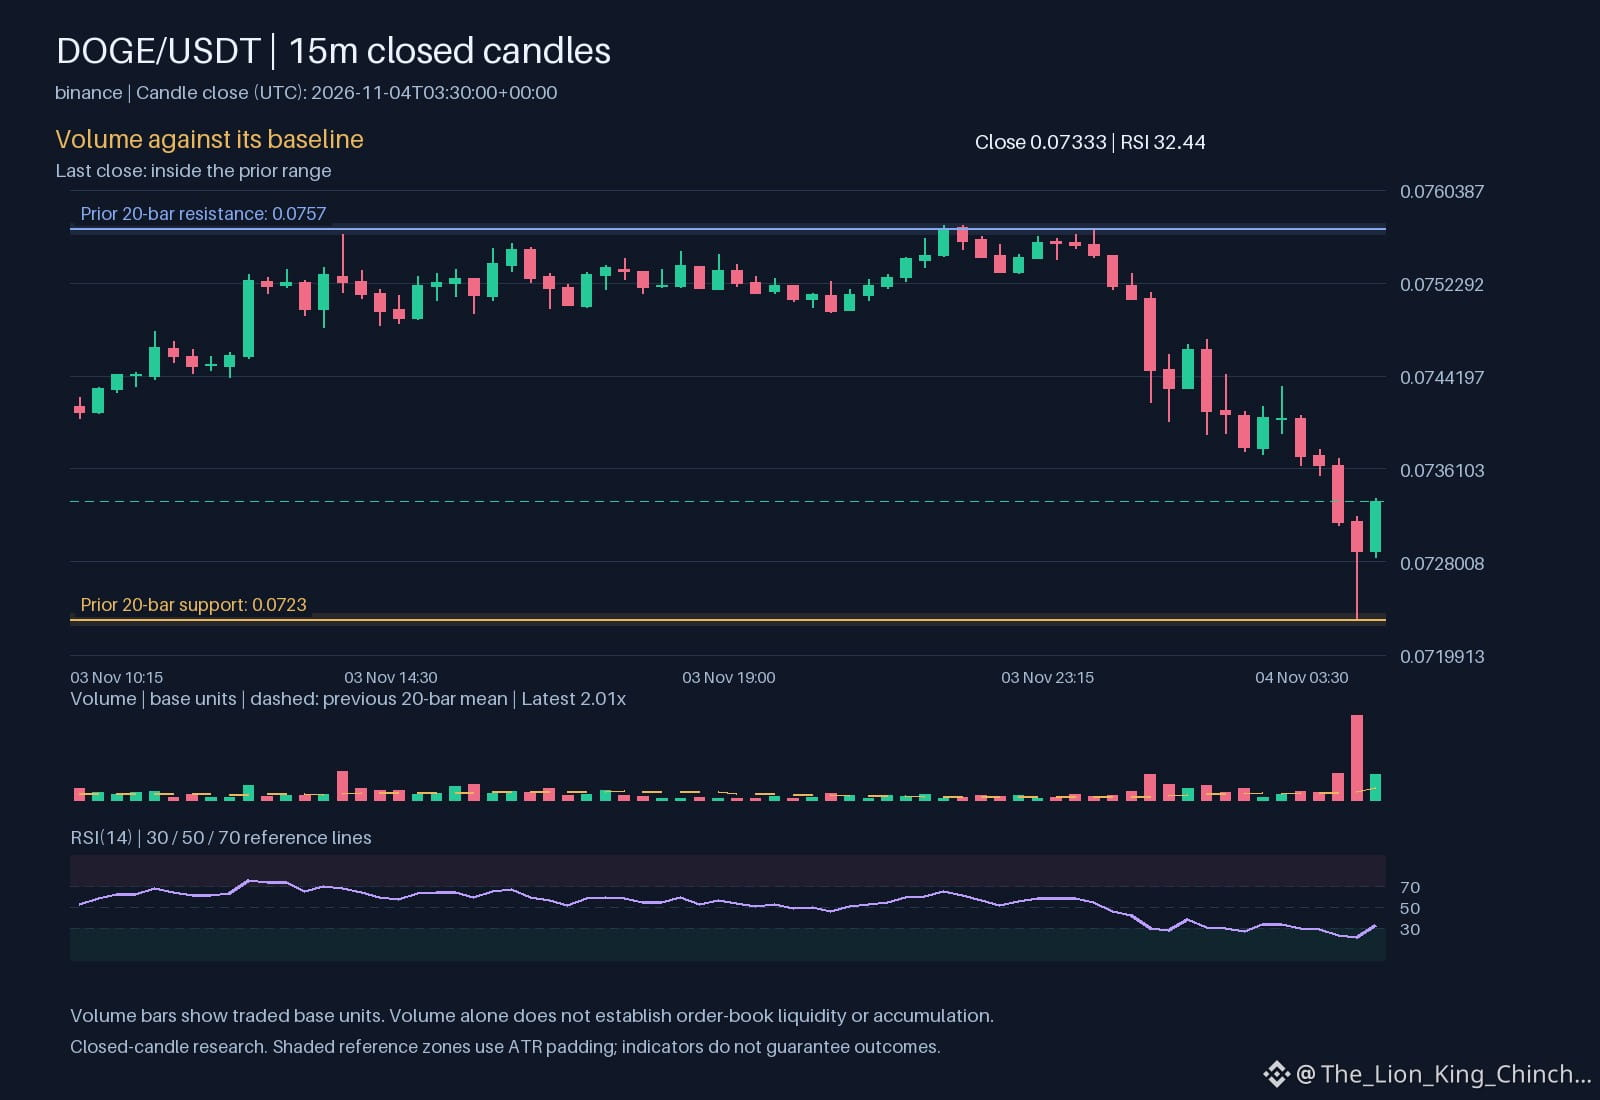
**Answer**: Not always. The candle’s size reflects how much trading happened in that hour, but it does not tell us why traders entered. When volume is above baseline, as we see for $DOGE with relative volume 2.00842, the market is active. However, activity can be split between buyers and sellers. If sellers dominate, the price may still drop; if buyers step in, the candle could be a false alarm.
**Mechanism**: Volume measures the number of contracts exchanged, not the direction of pressure. A high‑volume candle simply confirms that many participants were willing to trade at the current price level. To gauge direction, we compare the candle’s close to its open and look at where price sits relative to short‑term averages such as the 0.0741542 and 0.0746109. If the close is below both averages and the hourly direction remains down, the candle likely reflects selling pressure. Conversely, a close above those averages could indicate buying strength despite the down‑trend label.
**When the explanation stops applying**: The logic weakens if the market switches to a low‑volume environment. With volume back to baseline, a single candle loses its diagnostic power and we must rely on broader patterns or additional indicators like the RSI 32.4388. Re‑assessing means checking whether the next hour’s volume returns to normal and whether price respects the 0.0723 level before acting on the candle’s size. 🧐
Probabilistic market research, not a recommendation or guaranteed return.
Which trading assumption would you like to question next?
#DOGE #CryptoLearning
**Myth**: A loud candle on the hourly chart means the price will keep falling.
**Answer**: Not always. The candle’s size reflects how much trading happened in that hour, but it does not tell us why traders entered. When volume is above baseline, as we see for $DOGE with relative volume 2.00842, the market is active. However, activity can be split between buyers and sellers. If sellers dominate, the price may still drop; if buyers step in, the candle could be a false alarm.
**Mechanism**: Volume measures the number of contracts exchanged, not the direction of pressure. A high‑volume candle simply confirms that many participants were willing to trade at the current price level. To gauge direction, we compare the candle’s close to its open and look at where price sits relative to short‑term averages such as the 0.0741542 and 0.0746109. If the close is below both averages and the hourly direction remains down, the candle likely reflects selling pressure. Conversely, a close above those averages could indicate buying strength despite the down‑trend label.
**When the explanation stops applying**: The logic weakens if the market switches to a low‑volume environment. With volume back to baseline, a single candle loses its diagnostic power and we must rely on broader patterns or additional indicators like the RSI 32.4388. Re‑assessing means checking whether the next hour’s volume returns to normal and whether price respects the 0.0723 level before acting on the candle’s size. 🧐
Probabilistic market research, not a recommendation or guaranteed return.
Which trading assumption would you like to question next?
#DOGE #CryptoLearning