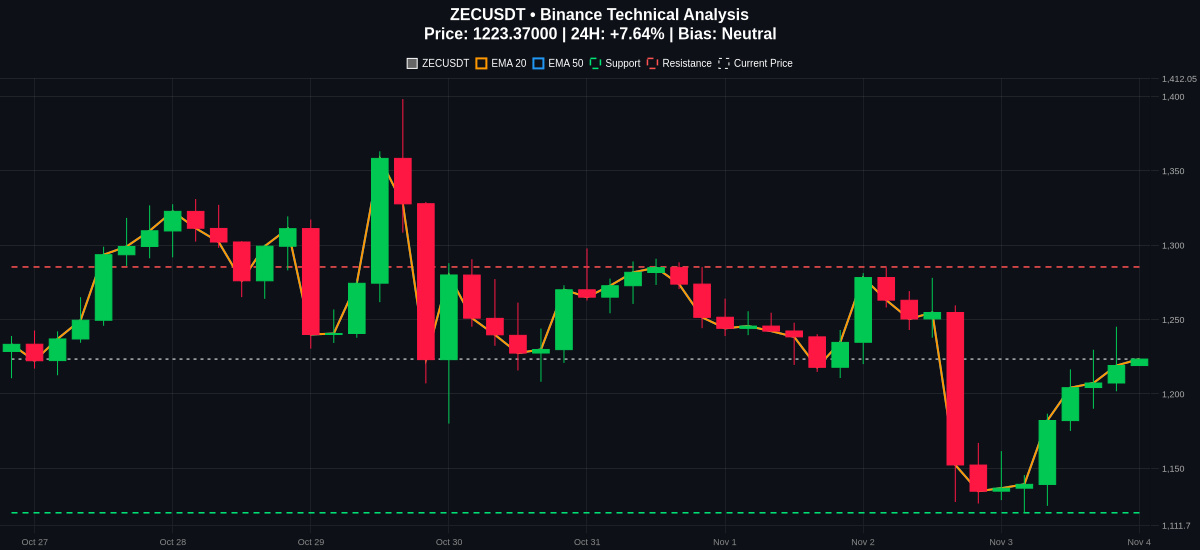
$ZEC is holding right above the 20-period exponential moving average, showing an interesting equilibrium on the charts.
Let us break down the current market structure for ZECUSDT trading at 1223.37 with a 24-hour gain of 7.64 percent.
The price sits closely between the EMA20 at 1214.03 and the EMA50 at 1229.65, pointing to a tight consolidation phase right in the middle of key moving averages.
Momentum indicators show the RSI at 50.57, which reflects a neutral stance with neither buyers nor sellers in total control. Meanwhile, the MACD line at -14.84 sits slightly above the MACD signal line at -17.53, hinting at mild underlying momentum that could develop further if volume follows.
On the higher time frame perspective, overhead resistance is marked clearly at 1285.29. On the downside, local support is established around 1120.03, which serves as a crucial invalidation or risk management level if the structure breaks.
Managing risk is essential here since market conditions can shift rapidly.
Are you looking to long this range or waiting for a clearer breakout above resistance?
#ZEC #CryptoAnalysis #TechnicalSetup
Follow me for more updates 📊
Let us break down the current market structure for ZECUSDT trading at 1223.37 with a 24-hour gain of 7.64 percent.
The price sits closely between the EMA20 at 1214.03 and the EMA50 at 1229.65, pointing to a tight consolidation phase right in the middle of key moving averages.
Momentum indicators show the RSI at 50.57, which reflects a neutral stance with neither buyers nor sellers in total control. Meanwhile, the MACD line at -14.84 sits slightly above the MACD signal line at -17.53, hinting at mild underlying momentum that could develop further if volume follows.
On the higher time frame perspective, overhead resistance is marked clearly at 1285.29. On the downside, local support is established around 1120.03, which serves as a crucial invalidation or risk management level if the structure breaks.
Managing risk is essential here since market conditions can shift rapidly.
Are you looking to long this range or waiting for a clearer breakout above resistance?
#ZEC #CryptoAnalysis #TechnicalSetup
Follow me for more updates 📊