BSB Bounces Off $0.084 but Stays Below the Key Averages: Relief Rally or Real Reversal?
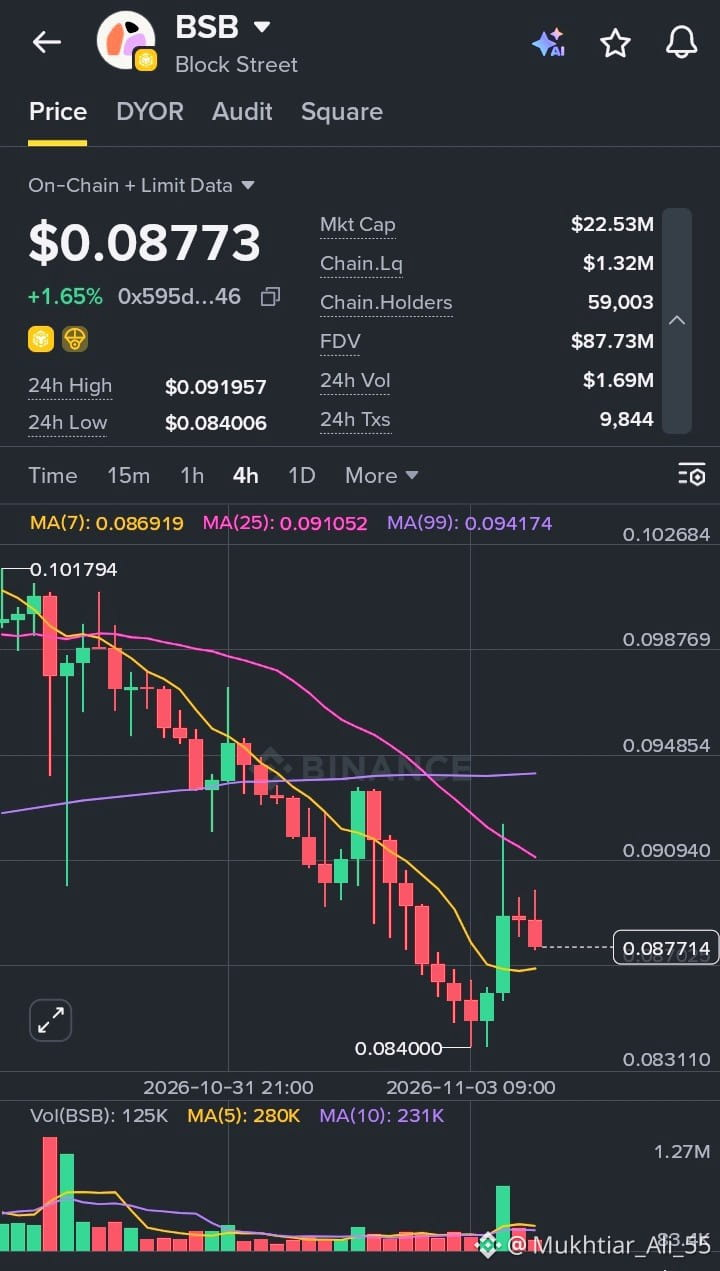
Block Street (BSB) is trading around $0.08773, up 1.65% on the day, and the 4H chart shows a modest recovery inside a larger downtrend.
After the steady slide from the $0.101794 peak, price bottomed at $0.084000 and bounced with a sharp green candle that spiked toward $0.0919. Sellers stepped in quickly, and the last few candles have drifted lower, bringing price back down to the MA(7).
What the chart is showing:
24h range: $0.084006 to $0.091957
24h volume: about $1.69M, with 9.8K transactions
Market cap: $22.53M, FDV: $87.73M
On-chain liquidity: about $1.32M, with roughly 59K holders
MA(7): 0.086919, flattening and sitting just below price as thin support
MA(25): 0.091052 and MA(99): 0.094174, both sloping down and stacked overhead as resistance
Volume: a clear spike on the bounce candle, with the MA(5) above the MA(10), but the latest bars are fading
My take: The bounce from $0.084 is a good start, but the bigger trend is still bearish. Price is making lower highs, and the long upper wick on the bounce candle shows sellers are active near $0.091. The first level to hold is the MA(7) near $0.0869. If it breaks, the $0.0840 low becomes the key support, and losing it could open the door to deeper levels. For bulls, a clean 4H close above the 24h high at $0.0920 would be the first real sign of strength, with the MA(25) near $0.0911 as the first hurdle on the way up.
Also worth noting, the FDV is about four times the current market cap, so future supply can add pressure over time. With liquidity at a modest level, moves can be sharp in either direction. I’m waiting for a reclaim of the MA(25) with volume behind it before getting interested.
#BlockStreet #BSB #CryptoAnalysis #TechnicalAnalysis #Altcoins
$BSB
Block Street (BSB) is trading around $0.08773, up 1.65% on the day, and the 4H chart shows a modest recovery inside a larger downtrend.
After the steady slide from the $0.101794 peak, price bottomed at $0.084000 and bounced with a sharp green candle that spiked toward $0.0919. Sellers stepped in quickly, and the last few candles have drifted lower, bringing price back down to the MA(7).
What the chart is showing:
24h range: $0.084006 to $0.091957
24h volume: about $1.69M, with 9.8K transactions
Market cap: $22.53M, FDV: $87.73M
On-chain liquidity: about $1.32M, with roughly 59K holders
MA(7): 0.086919, flattening and sitting just below price as thin support
MA(25): 0.091052 and MA(99): 0.094174, both sloping down and stacked overhead as resistance
Volume: a clear spike on the bounce candle, with the MA(5) above the MA(10), but the latest bars are fading
My take: The bounce from $0.084 is a good start, but the bigger trend is still bearish. Price is making lower highs, and the long upper wick on the bounce candle shows sellers are active near $0.091. The first level to hold is the MA(7) near $0.0869. If it breaks, the $0.0840 low becomes the key support, and losing it could open the door to deeper levels. For bulls, a clean 4H close above the 24h high at $0.0920 would be the first real sign of strength, with the MA(25) near $0.0911 as the first hurdle on the way up.
Also worth noting, the FDV is about four times the current market cap, so future supply can add pressure over time. With liquidity at a modest level, moves can be sharp in either direction. I’m waiting for a reclaim of the MA(25) with volume behind it before getting interested.
#BlockStreet #BSB #CryptoAnalysis #TechnicalAnalysis #Altcoins
$BSB