Market Overview on $TRX
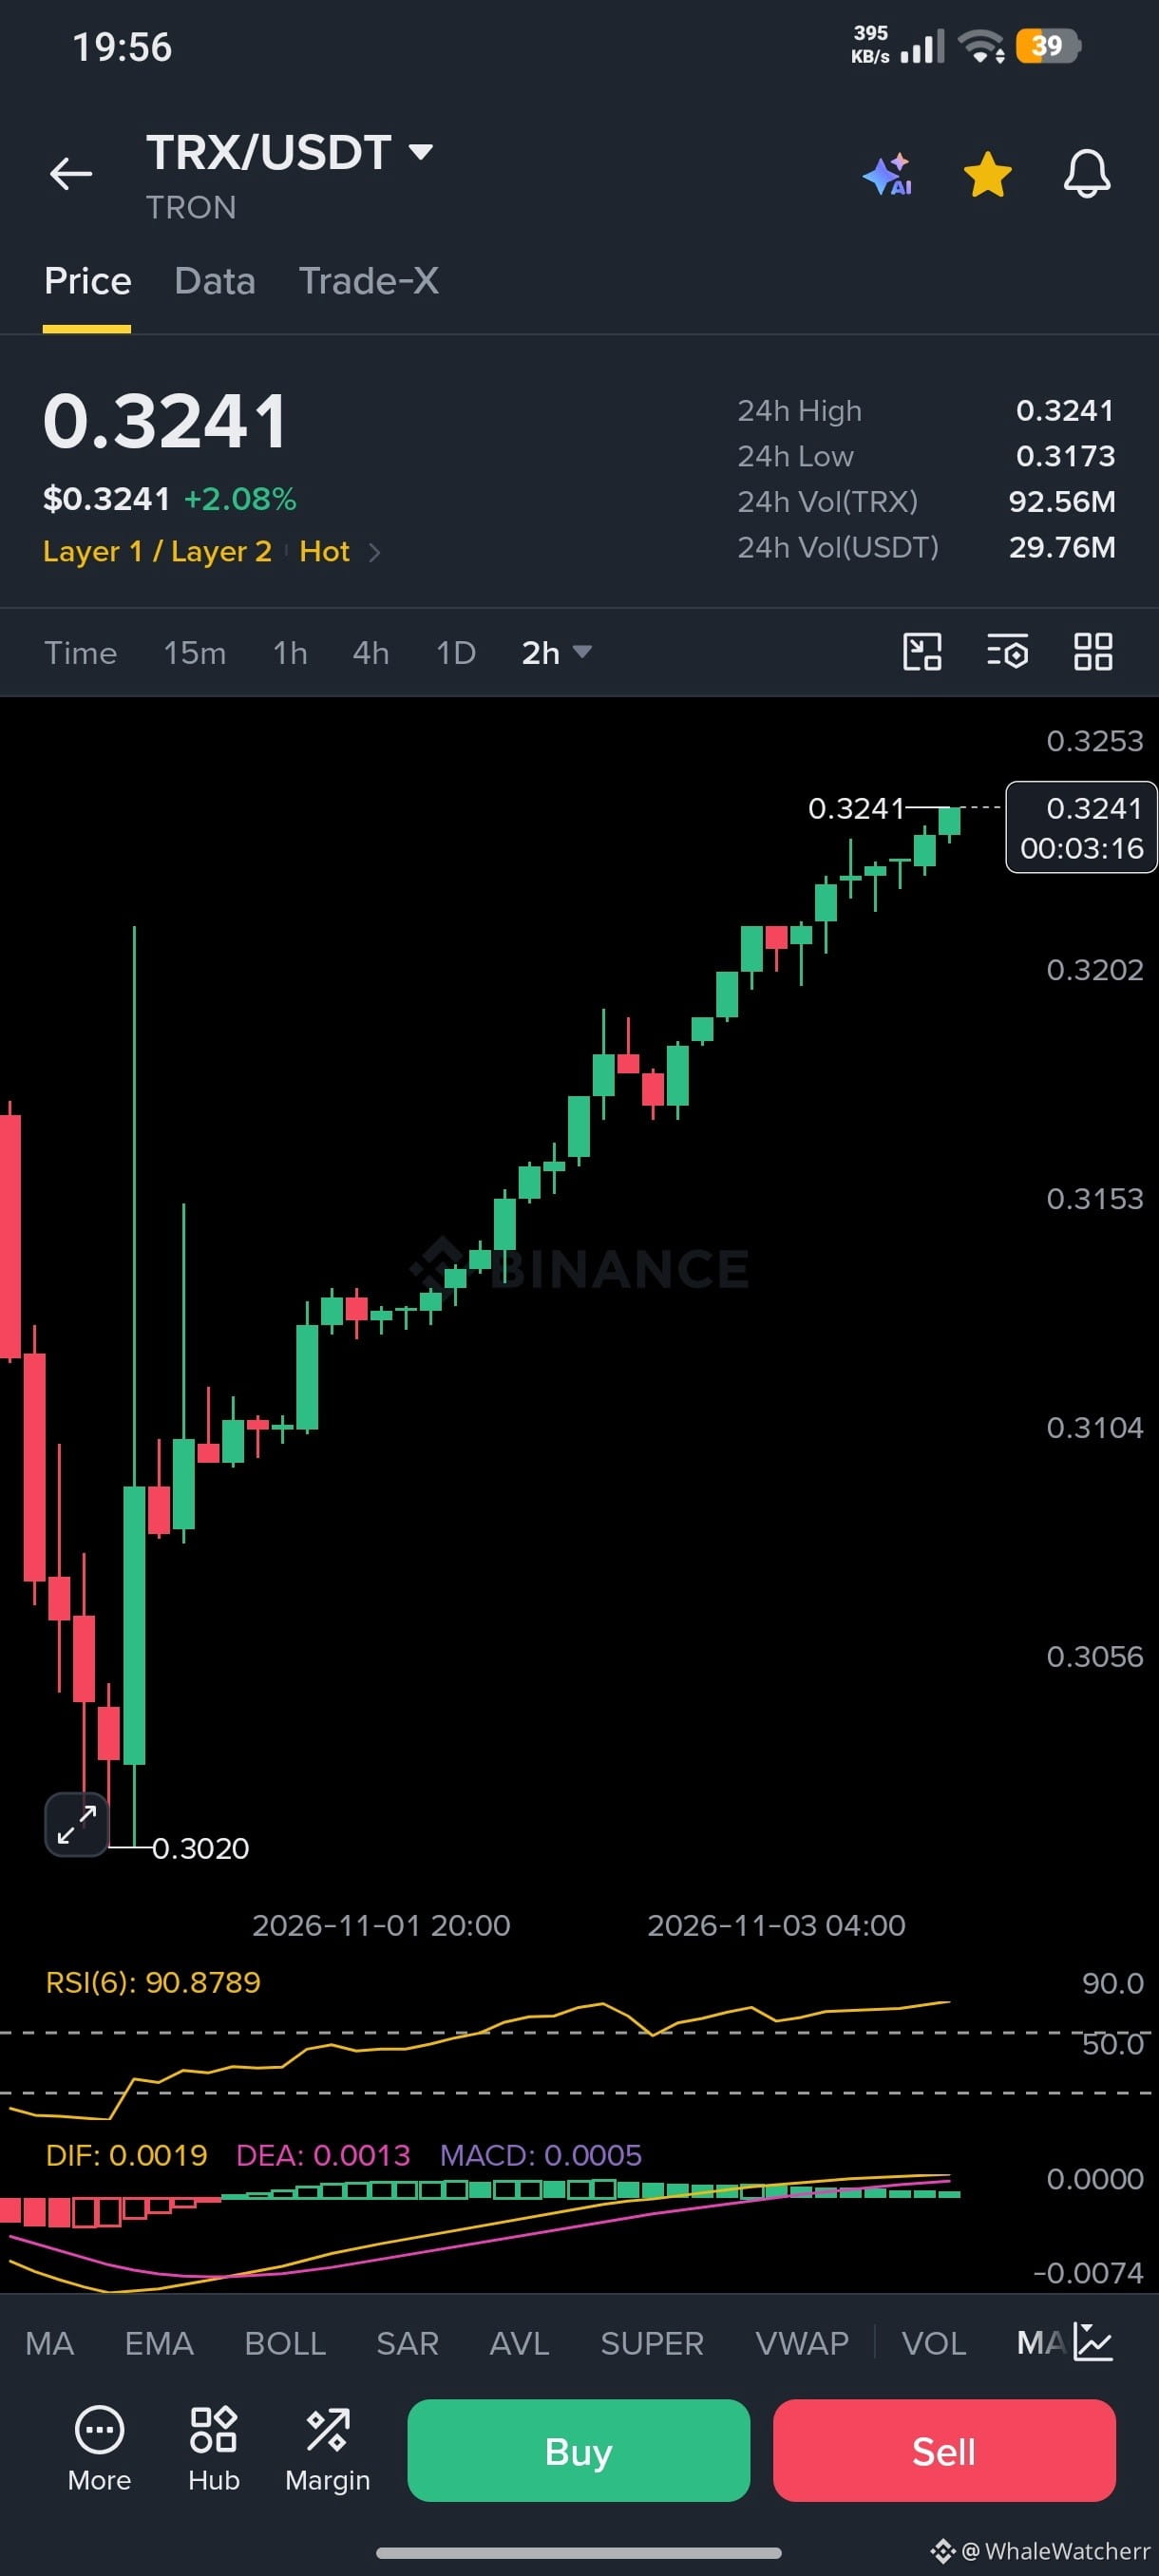
TRX is trading at 0.3241, up 2.08% on the day. The 24h range sits between 0.3173 and 0.3241, so price is pressing right at the daily high. On the 2H chart, TRX bottomed near 0.3020 and bounced sharply. It has since built a clean staircase of higher highs and higher lows, with only shallow red candles along the way. Buyers are clearly in control, and the recent pullbacks have been bought quickly.
$TRX
Technical Analysis
RSI(6) is at 90.88, deep in overbought territory. That confirms strong momentum, but it also raises the odds of a pause or a short-term cooldown. MACD supports the bullish picture: DIF (0.0019) is above DEA (0.0013) and both are above the zero line. The histogram is green but small, so momentum is positive and no longer accelerating.
Nearby resistance is at 0.3253, the top of the visible range. Support levels are at 0.3202, 0.3153 and 0.3104, with 0.3020 as the major swing low.
$TRX
TRX is trading at 0.3241, up 2.08% on the day. The 24h range sits between 0.3173 and 0.3241, so price is pressing right at the daily high. On the 2H chart, TRX bottomed near 0.3020 and bounced sharply. It has since built a clean staircase of higher highs and higher lows, with only shallow red candles along the way. Buyers are clearly in control, and the recent pullbacks have been bought quickly.
$TRX
Technical Analysis
RSI(6) is at 90.88, deep in overbought territory. That confirms strong momentum, but it also raises the odds of a pause or a short-term cooldown. MACD supports the bullish picture: DIF (0.0019) is above DEA (0.0013) and both are above the zero line. The histogram is green but small, so momentum is positive and no longer accelerating.
Nearby resistance is at 0.3253, the top of the visible range. Support levels are at 0.3202, 0.3153 and 0.3104, with 0.3020 as the major swing low.
$TRX