🐻 BNB: Sellers Still Have the Upper Hand?
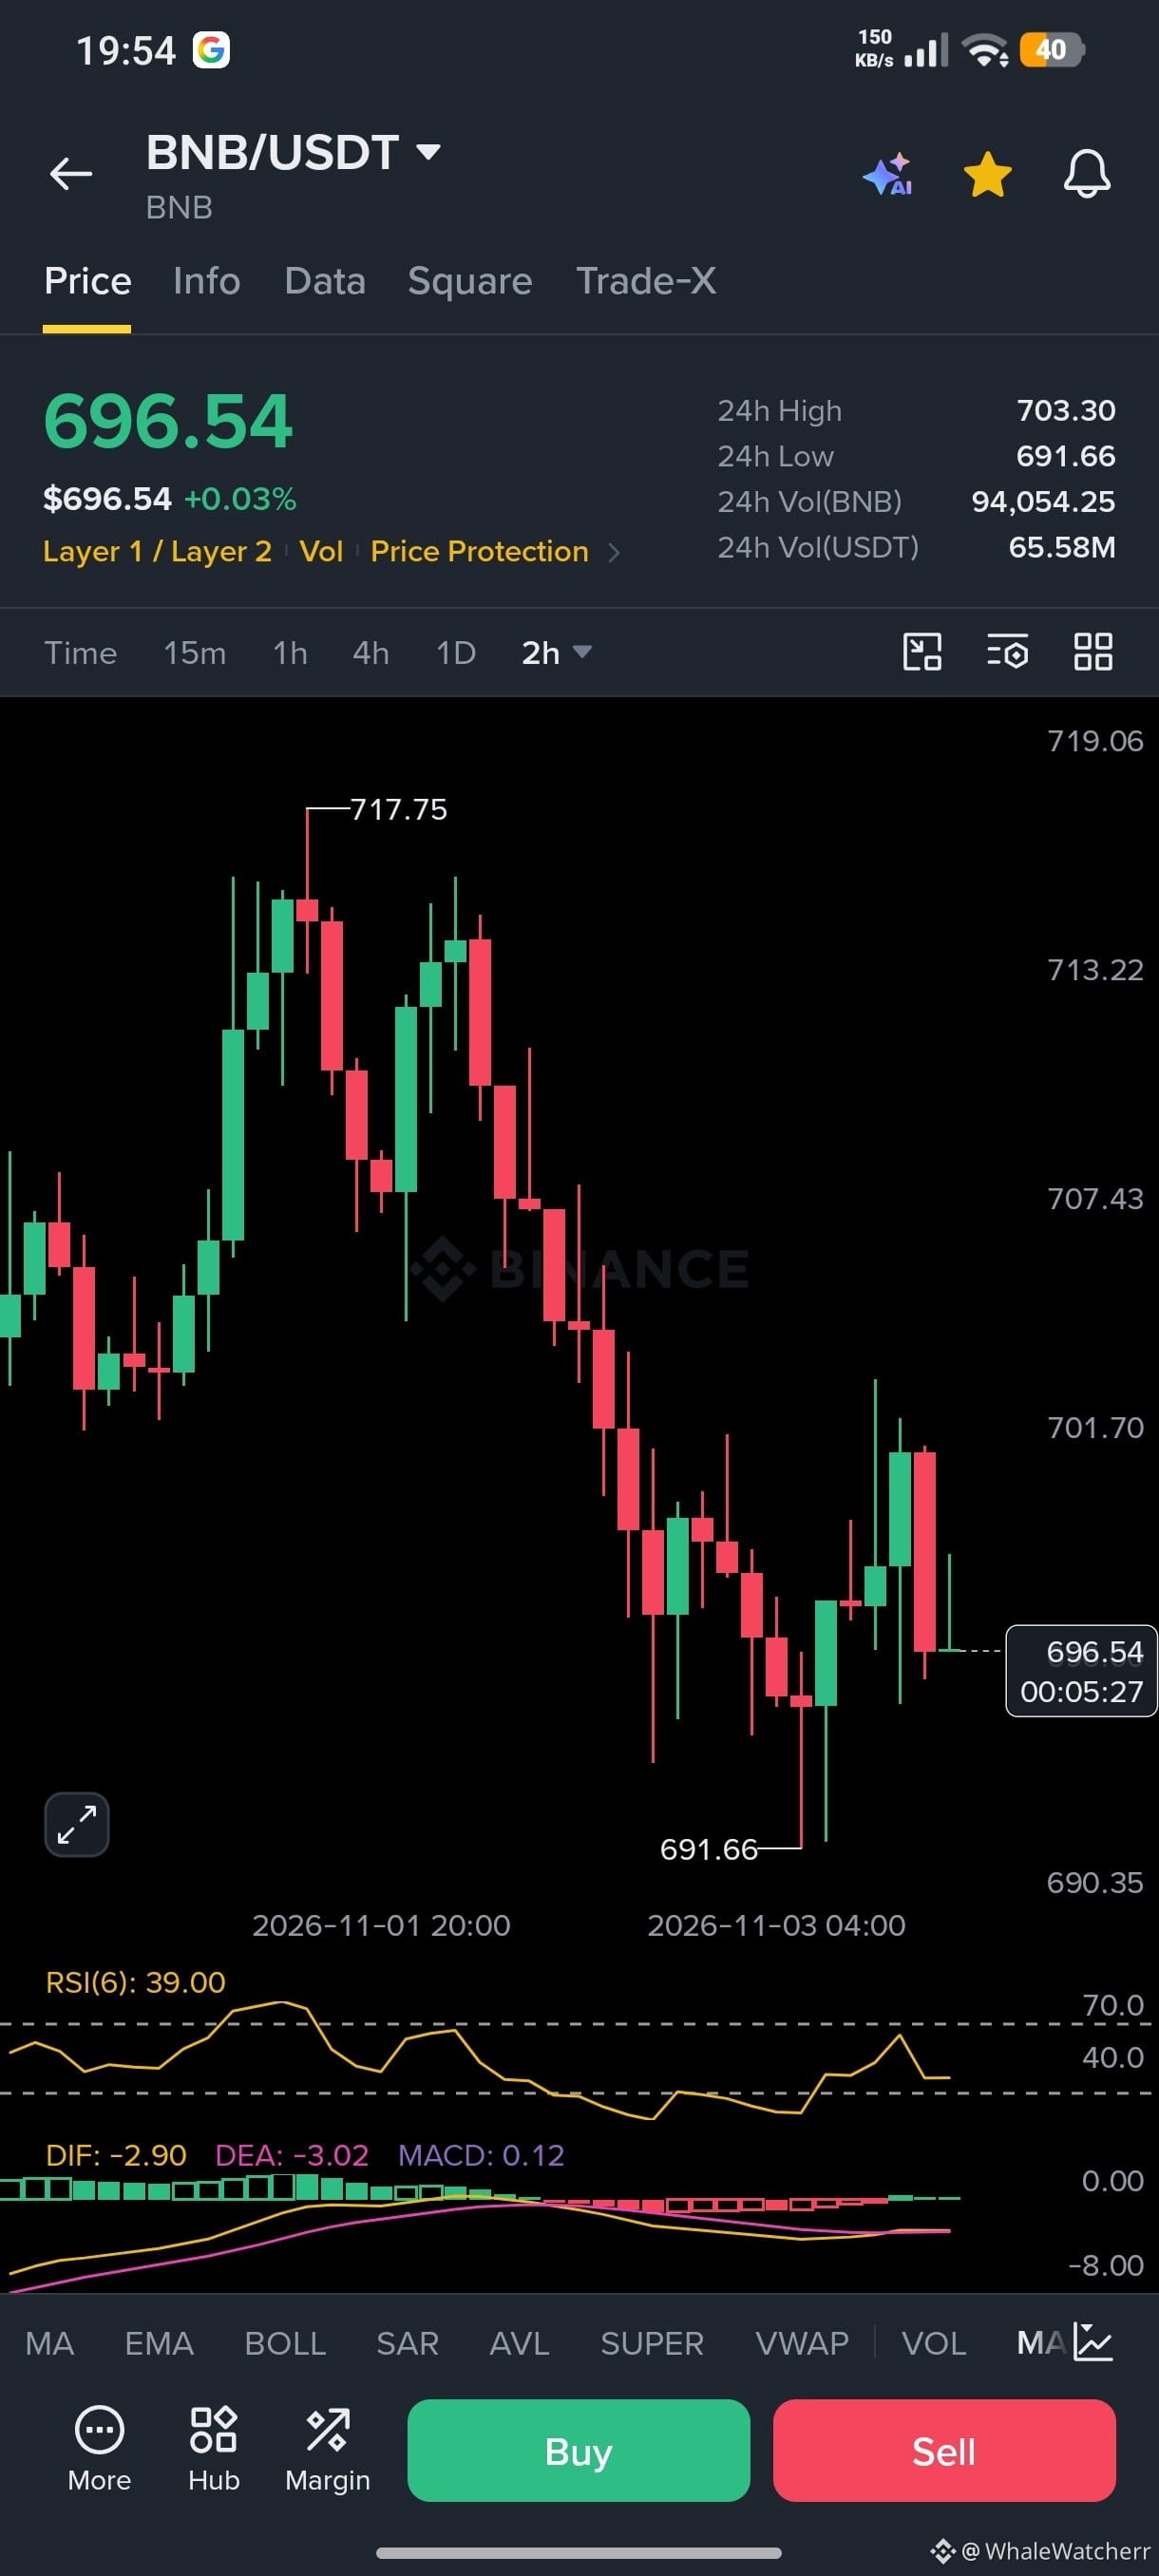
BNB is trading around $696.54 on the 2H chart, struggling to recover after falling from the $717.75 peak. The recent low sits at $691.66, making this an important area to watch.
$BNB
RSI(6) is at 39, showing weak momentum. However, the MACD histogram has turned slightly positive (0.12), hinting at a possible slowdown in selling pressure.
$BNB
📍 Resistance: $701.70 → $707.43
📍 Support: $691.66 → $690.35
Will BNB manage a stronger recovery, or will sellers push it toward another test of the lows?
$BNB
BNB is trading around $696.54 on the 2H chart, struggling to recover after falling from the $717.75 peak. The recent low sits at $691.66, making this an important area to watch.
$BNB
RSI(6) is at 39, showing weak momentum. However, the MACD histogram has turned slightly positive (0.12), hinting at a possible slowdown in selling pressure.
$BNB
📍 Resistance: $701.70 → $707.43
📍 Support: $691.66 → $690.35
Will BNB manage a stronger recovery, or will sellers push it toward another test of the lows?
$BNB