$HUMA
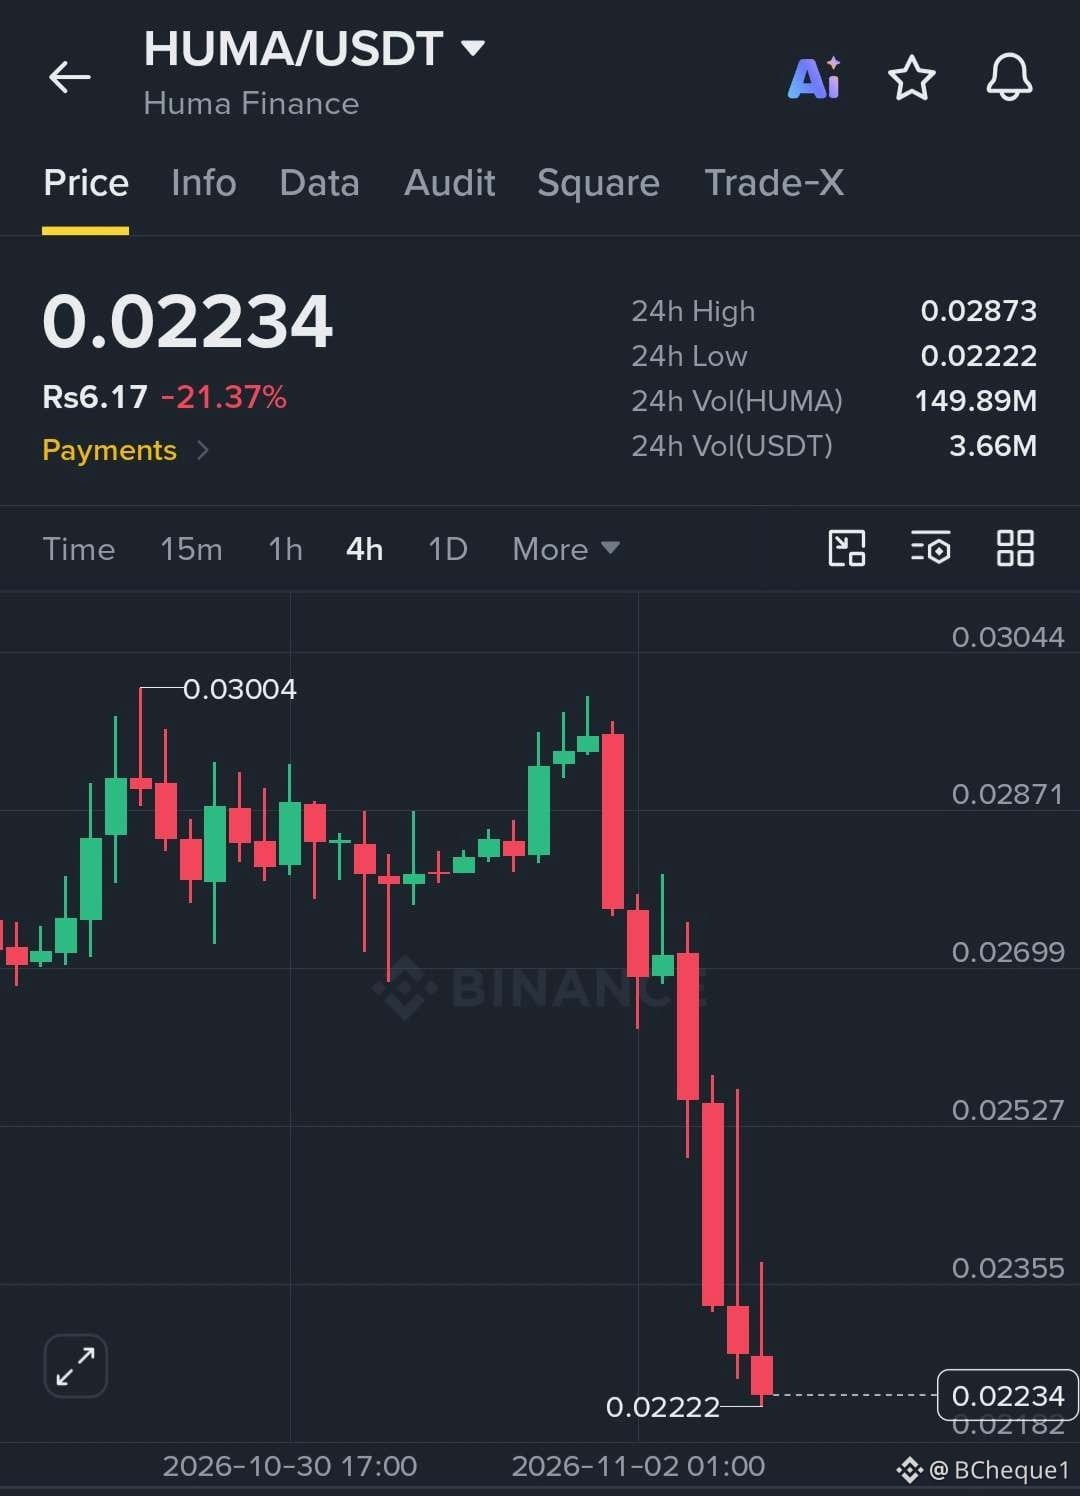
The 4H chart shows strong selling pressure. HUMA has broken multiple support levels with consecutive bearish candles and is currently testing its recent low at 0.02222.
Wait for a pullback towards 0.02300–0.02350.
Look for bearish rejection on 15m or 1H.
Enter short only after confirmation.
Avoid chasing the current candle. Wait for a retest.
Use low leverage and risk no more than 1% of trading capital. This is a chart-based setup, not a guaranteed signal.
$HUMA
The 4H chart shows strong selling pressure. HUMA has broken multiple support levels with consecutive bearish candles and is currently testing its recent low at 0.02222.
Wait for a pullback towards 0.02300–0.02350.
Look for bearish rejection on 15m or 1H.
Enter short only after confirmation.
Avoid chasing the current candle. Wait for a retest.
Use low leverage and risk no more than 1% of trading capital. This is a chart-based setup, not a guaranteed signal.
$HUMA