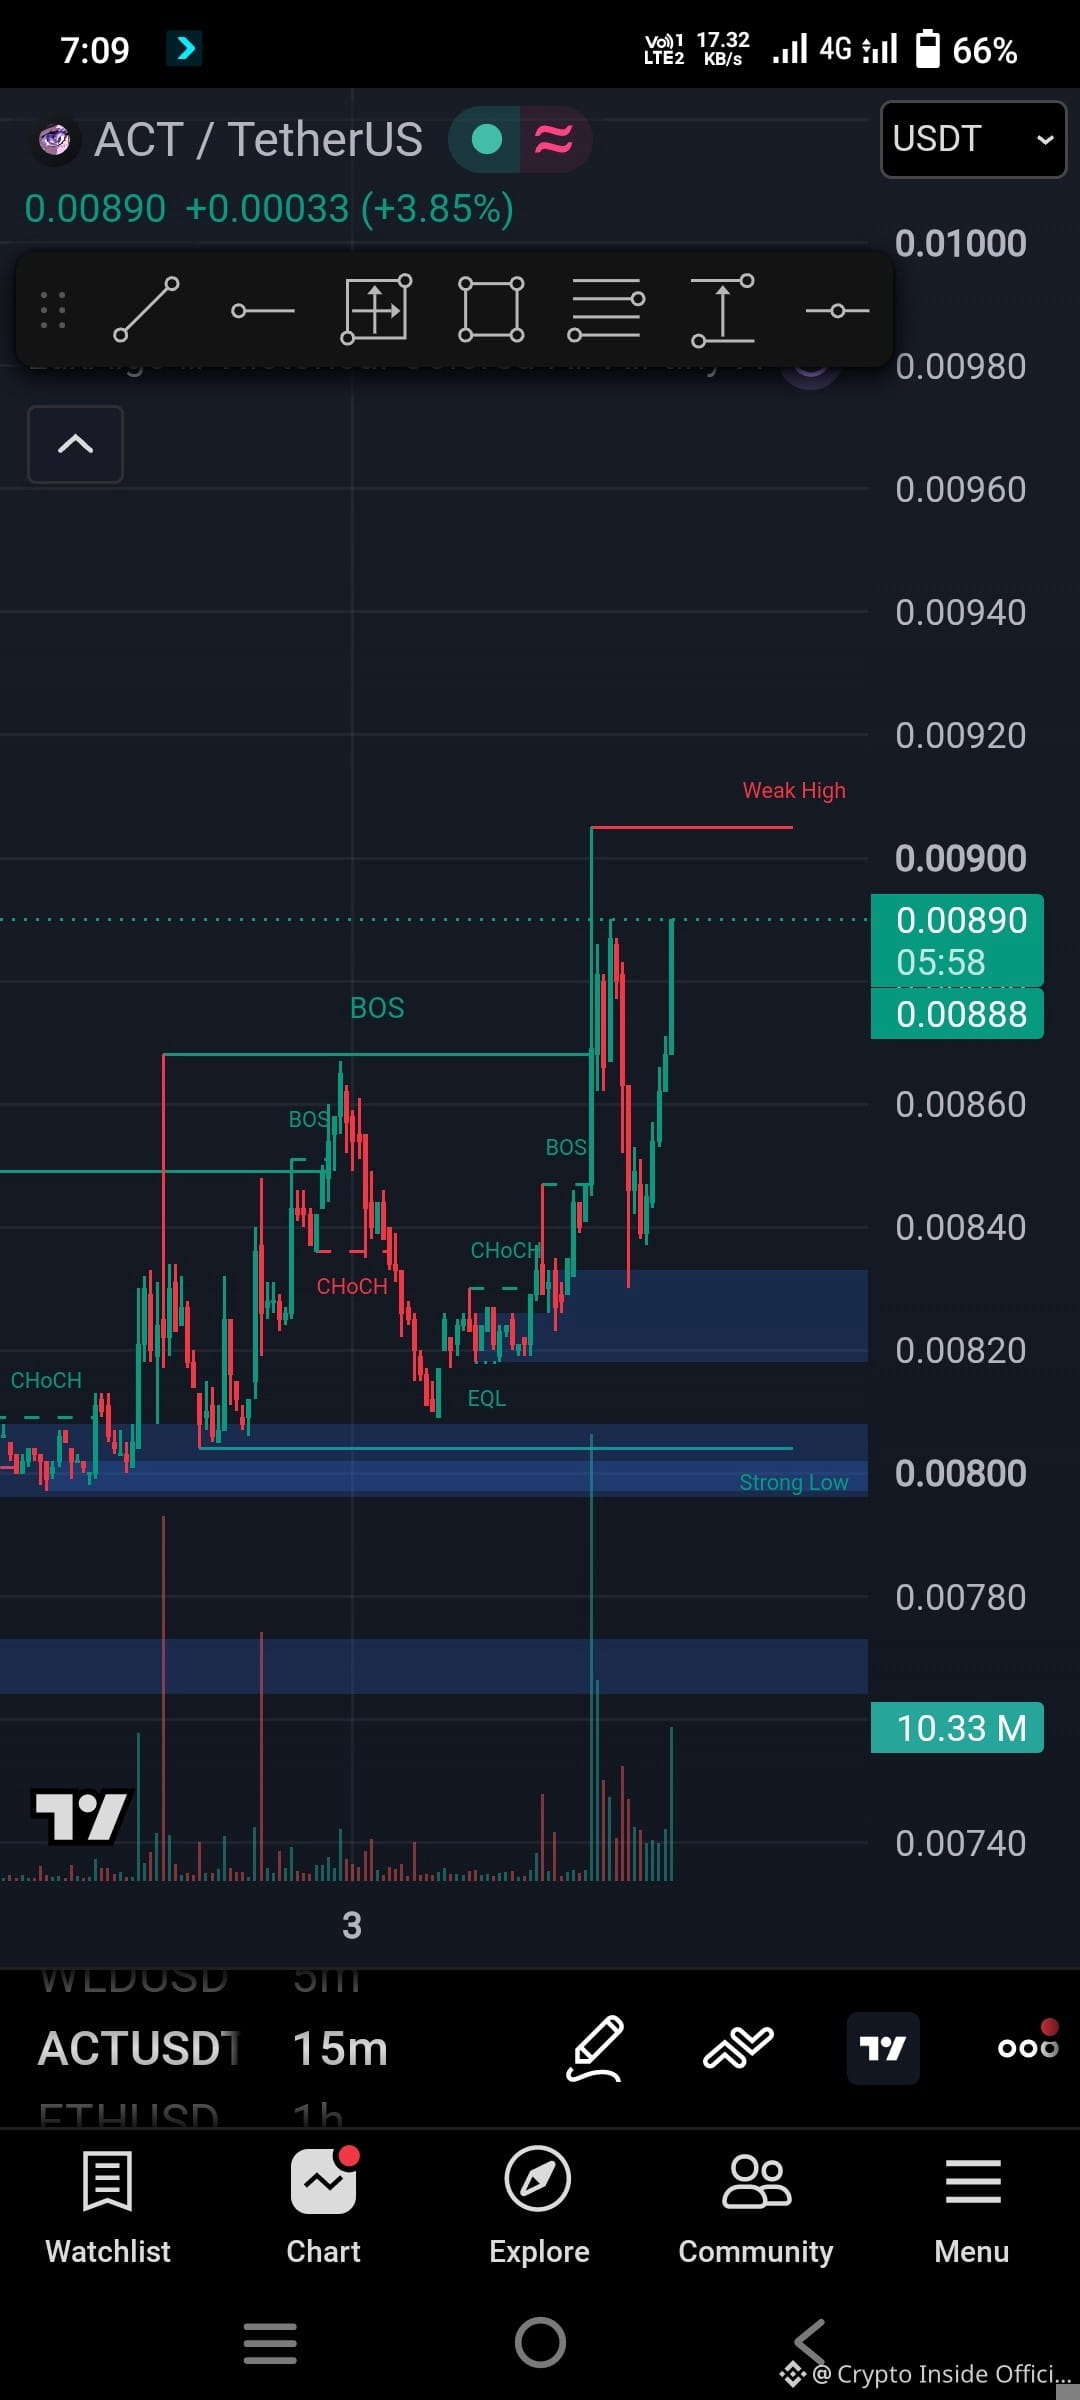
Technical and Fundamental Analysis $ACT On $SOL Blockchain
Market Overview
Current Price: ~$0.0081 – $0.0084 USD
24-Hour Range: ~$0.00757 – $0.00856 USD
24-Hour Change: Down roughly 4% to 5%
Market Sentiment: Short-term trend leans bearish/neutral, with moving averages pointing to prevailing overhead pressure.
Key Technical Levels
Immediate Support: ~$0.0075 – $0.0076 USD (Recent 24h low territory; holding this zone is critical to prevent deeper slides).
Immediate Resistance:
R1: ~$0.00886 USD
R2: ~$0.00925 USD
D
Moving Averages (Daily): The 20-day EMA sits near $0.00898, and the 50-day EMA sits around $0.00961, acting as immediate dynamic resistance lines.
Trade Setup Considerations
Scenario A: Range-Bound / Mean Reversion (Short-Term Scalping)
Bias: Neutral to cautious long on dips.
Entry Zone: Look for stabilization and bullish price action closer to immediate support ($0.0076 – $0.0078).
Take Profit: Scale out incrementally near short-term resistance ($0.0085 – $0.0088).
Stop Loss: Tight stop just below structural support (e.g., under $0.0074).
Scenario B: Breakdown Continuation (Short / Momentum Play)
Bias: Bearish continuation if macro weakness persists.
Entry Zone: On a confirmed high-volume breakdown and retest failure below $0.0075.
Take Profit: Target lower liquidity pockets toward $0.0070 or lower.
Stop Loss: Just above the breakdown pivot level (e.g., above $0.0078).
Note: Given the high short-term volatility and weak momentum on higher timeframes, keep position sizes disciplined and monitor order book depth closely for sudden shifts.
$BTC #solana #Act
Market Overview
Current Price: ~$0.0081 – $0.0084 USD
24-Hour Range: ~$0.00757 – $0.00856 USD
24-Hour Change: Down roughly 4% to 5%
Market Sentiment: Short-term trend leans bearish/neutral, with moving averages pointing to prevailing overhead pressure.
Key Technical Levels
Immediate Support: ~$0.0075 – $0.0076 USD (Recent 24h low territory; holding this zone is critical to prevent deeper slides).
Immediate Resistance:
R1: ~$0.00886 USD
R2: ~$0.00925 USD
D
Moving Averages (Daily): The 20-day EMA sits near $0.00898, and the 50-day EMA sits around $0.00961, acting as immediate dynamic resistance lines.
Trade Setup Considerations
Scenario A: Range-Bound / Mean Reversion (Short-Term Scalping)
Bias: Neutral to cautious long on dips.
Entry Zone: Look for stabilization and bullish price action closer to immediate support ($0.0076 – $0.0078).
Take Profit: Scale out incrementally near short-term resistance ($0.0085 – $0.0088).
Stop Loss: Tight stop just below structural support (e.g., under $0.0074).
Scenario B: Breakdown Continuation (Short / Momentum Play)
Bias: Bearish continuation if macro weakness persists.
Entry Zone: On a confirmed high-volume breakdown and retest failure below $0.0075.
Take Profit: Target lower liquidity pockets toward $0.0070 or lower.
Stop Loss: Just above the breakdown pivot level (e.g., above $0.0078).
Note: Given the high short-term volatility and weak momentum on higher timeframes, keep position sizes disciplined and monitor order book depth closely for sudden shifts.
$BTC #solana #Act