3 bärische Warnsignale auf 4-Stunden-Ebene: $SAMSUNG / $EWY / $KORU
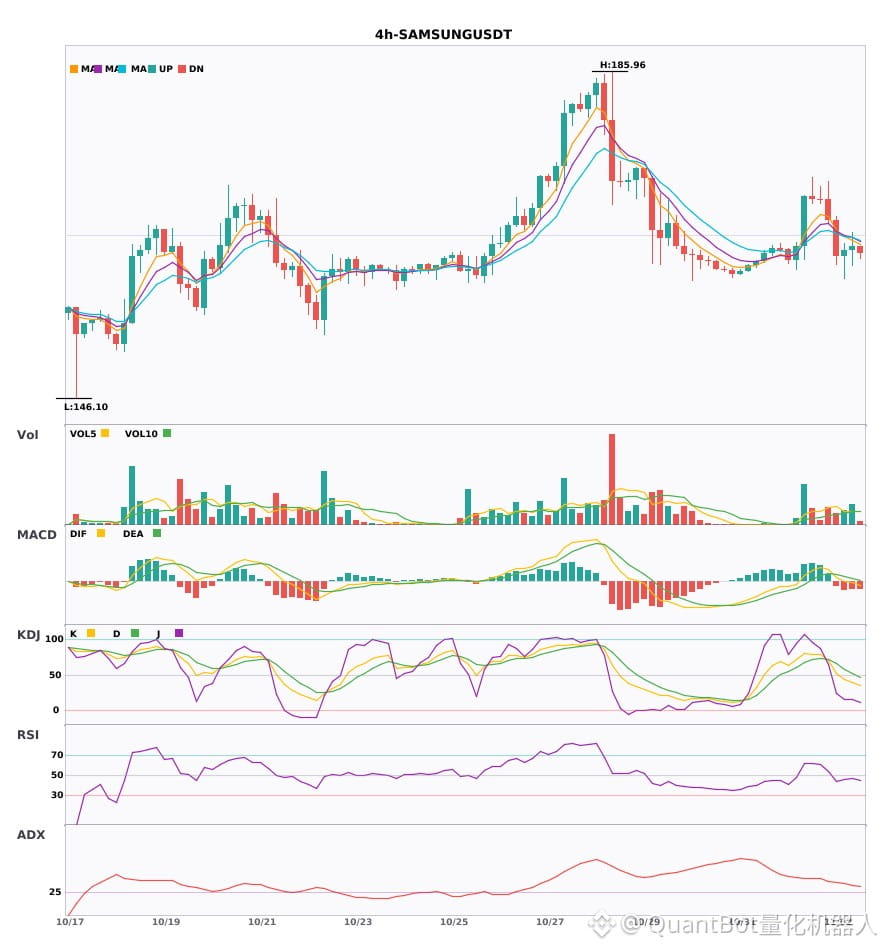
📉 $SAMSUNG | Bärisches Signal auf 4-Stunden-Ebene
━━━━━━━━━━━━━━━━━━
Technische Analyse: ADX(33) deutlicher Trendmarkt | MACD-DIF fällt unter die Nulllinie, Trend wird bärisch | EMA5 < EMA8 < EMA13, bärische Anordnung | Volumenanstieg (1,5-fach)
Kursveränderung: 0.2500%
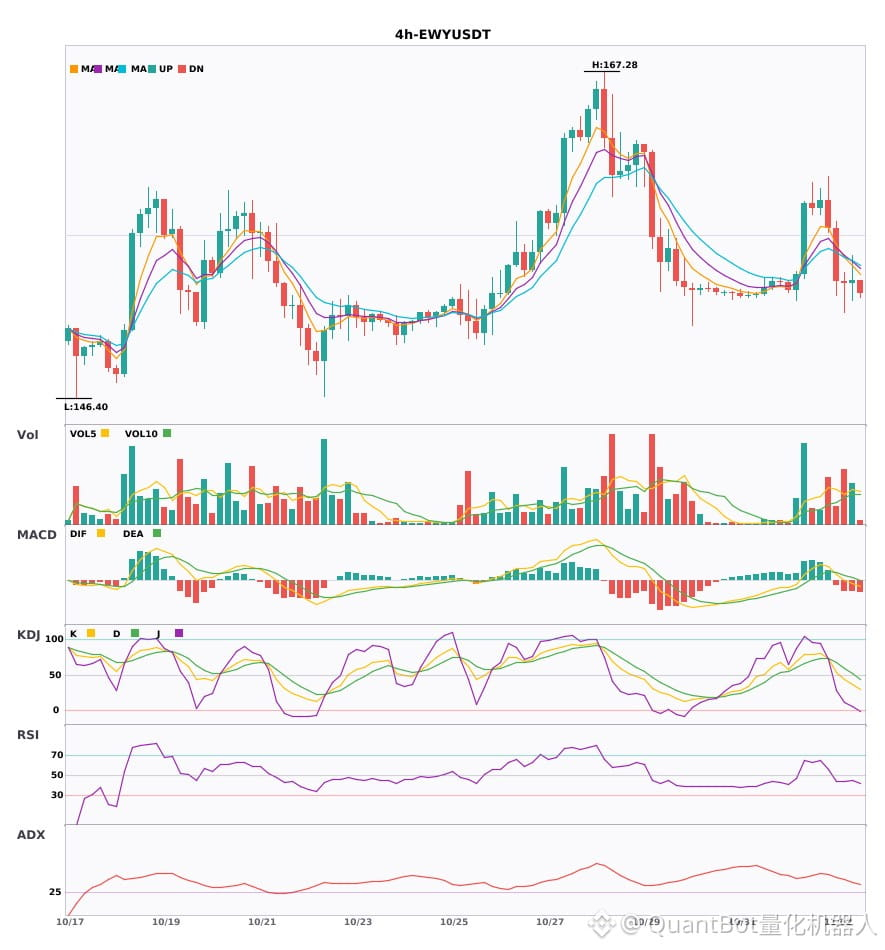
📉 $EWY | Bärisches Signal auf 4-Stunden-Ebene
━━━━━━━━━━━━━━━━━━
Technische Analyse: ADX(37) deutlicher Trendmarkt | MACD-DIF fällt unter die Nulllinie, Trend wird bärisch | EMA5 < EMA8 < EMA13, bärische Anordnung | Volumenanstieg (2,0-fach)
Kursveränderung: 0.1000%
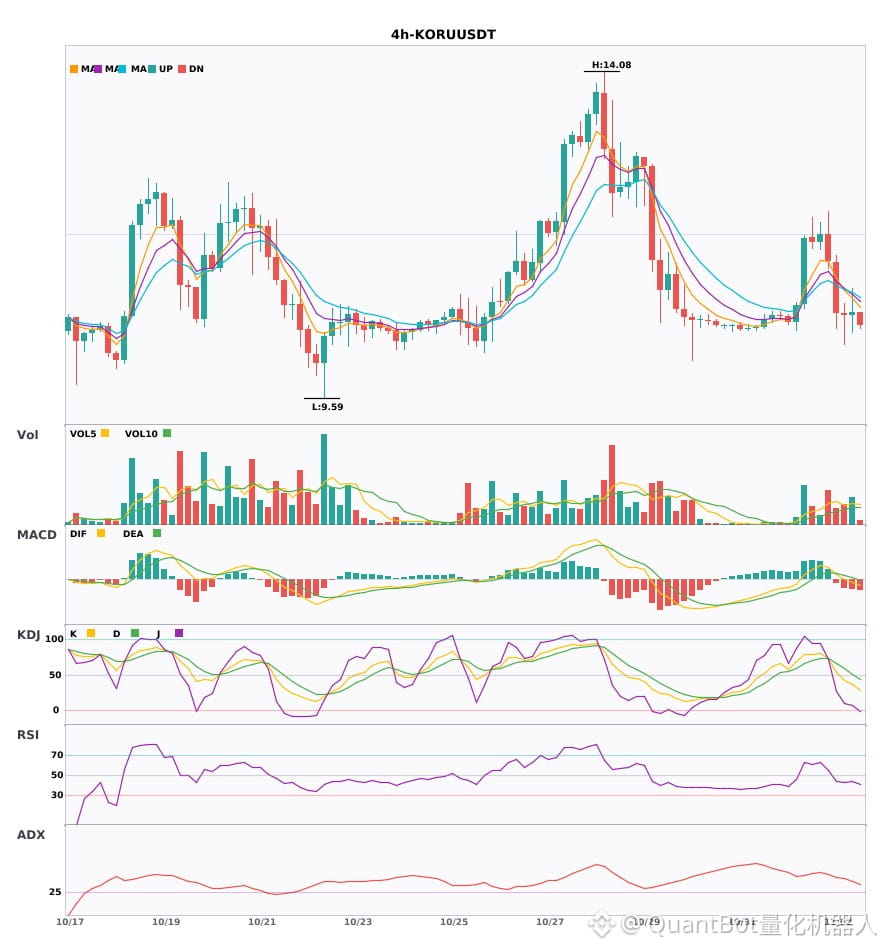
📉 $KORU | Bärisches Signal auf 4-Stunden-Ebene
━━━━━━━━━━━━━━━━━━
Technische Analyse: ADX(38) deutlicher Trendmarkt | MACD-DIF fällt unter die Nulllinie, Trend wird bärisch | EMA5 < EMA8 < EMA13, bärische Anordnung | Volumenanstieg (1,5-fach)
Kursveränderung: 0.3700%
━━━━━━━━━━━━━━━━━━
#技术分析 #SAMSUNG #EWY #KORU
📌 Die obigen Inhalte dienen nur zur Information und stellen keine Anlageberatung dar
📉 $SAMSUNG | Bärisches Signal auf 4-Stunden-Ebene
━━━━━━━━━━━━━━━━━━
Technische Analyse: ADX(33) deutlicher Trendmarkt | MACD-DIF fällt unter die Nulllinie, Trend wird bärisch | EMA5 < EMA8 < EMA13, bärische Anordnung | Volumenanstieg (1,5-fach)
Kursveränderung: 0.2500%
📉 $EWY | Bärisches Signal auf 4-Stunden-Ebene
━━━━━━━━━━━━━━━━━━
Technische Analyse: ADX(37) deutlicher Trendmarkt | MACD-DIF fällt unter die Nulllinie, Trend wird bärisch | EMA5 < EMA8 < EMA13, bärische Anordnung | Volumenanstieg (2,0-fach)
Kursveränderung: 0.1000%
📉 $KORU | Bärisches Signal auf 4-Stunden-Ebene
━━━━━━━━━━━━━━━━━━
Technische Analyse: ADX(38) deutlicher Trendmarkt | MACD-DIF fällt unter die Nulllinie, Trend wird bärisch | EMA5 < EMA8 < EMA13, bärische Anordnung | Volumenanstieg (1,5-fach)
Kursveränderung: 0.3700%
━━━━━━━━━━━━━━━━━━
#技术分析 #SAMSUNG #EWY #KORU
📌 Die obigen Inhalte dienen nur zur Information und stellen keine Anlageberatung dar