
FANG (Diamondback Energy) 1D Technical Analysis: Pullback After Testing $212.54
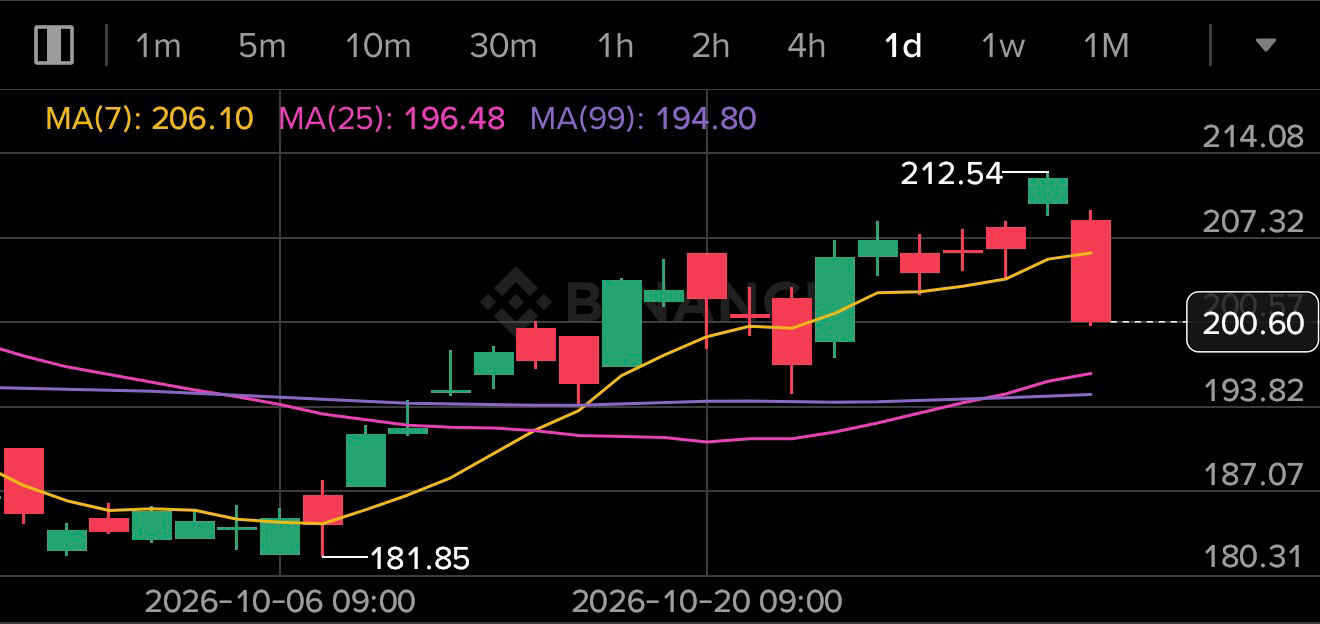
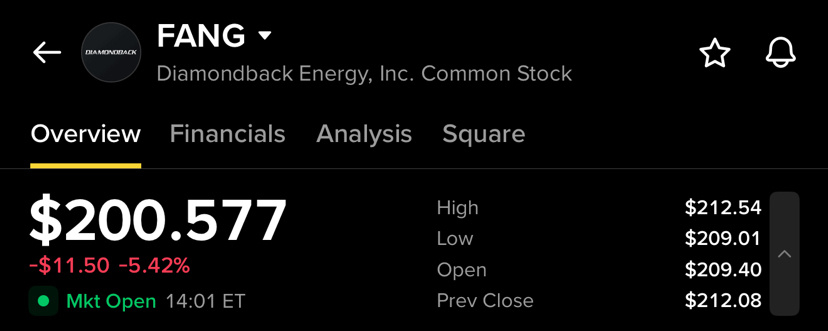
Diamondback Energy (FANG) is currently trading around $200.57, down approximately 5.42% on the session. The 1D chart shows an interesting setup: FANG recently pushed to a new short-term high near $212.54, but the latest session produced a strong bearish candle, bringing the price back toward the $200 area.
After a strong recovery from the $181.85 low, the stock has established a sequence of higher prices and moved above its major moving averages. The current pullback therefore deserves attention because it is testing an important technical area.
📈 Strong Recovery From $181.85
The recent structure started with FANG finding support around $181.85.
From that level, buyers gradually took control and pushed the stock higher. The recovery carried FANG through the $187, $193, and $200 areas before eventually reaching $212.54.
This was a significant improvement in the short-term structure because the stock moved from a lower range into a much stronger upward trend.
However, the latest candle shows that sellers became aggressive near the recent high.
🔴 Current Pullback Is Important
FANG is now trading around $200.57, after falling sharply from the $212.54 high.
The $200 level is psychologically important and also sits close to the recent price structure. Holding this region could allow buyers to stabilize the stock and potentially attempt another recovery.
A sustained move back above $207 would be an early indication that buyers are regaining momentum.
On the other hand, continued selling below $200 could bring the lower moving-average zones into focus.
📊 Moving Averages Show a Positive Background
The chart displays:
MA(7): $206.10
MA(25): $196.47
MA(99): $194.80
The short-term MA(7) is currently above the MA(25) and MA(99), which reflects the strength of the recent recovery.
More importantly, the price is still around and above the longer-term moving-average area despite today’s sharp decline.
The $194–$197 region therefore becomes an important technical zone.
If FANG finds support around this area and begins forming higher lows again, the broader recovery structure could remain intact.
🟢 Key Support Levels
The first level to watch is $200.
A successful defense of this psychological level could result in consolidation followed by another attempt toward the recent high.
Below $200, the next important area is approximately $193.80–$196.50, where the MA(25), MA(99), and previous price structure are located.
This zone could become particularly important if the current pullback continues.
A deeper decline would bring the $187 area into focus, while the previous swing low around $181.85 remains the major support visible on the chart.
🔥 Resistance Levels
On the upside, the first resistance zone is around $207–$208.
This area has recently acted as a trading zone before FANG moved toward its latest high.
The major resistance is the recent high at $212.54.
A decisive breakout above $212.54 would put FANG into a fresh price-discovery phase on this chart and could attract additional attention from momentum traders.
The market would need strong buying volume to make such a breakout more convincing.
📉 Volume Needs Attention
The latest decline occurred with noticeable selling activity, while the recent rally also showed periods of increased volume.
Volume will therefore be an important confirmation tool from here.
If FANG stabilizes around $200 or the $194–$197 zone while selling volume decreases, it could indicate that the pullback is losing momentum.
Conversely, increasing volume during further downside movement would suggest that sellers remain in control.
🧠 Bullish vs Bearish Scenario
🟢 Bullish Scenario
If FANG holds the $200 area and quickly reclaims $206–$207, buyers could attempt another move toward $212.54.
A clean breakout above $212.54, especially with stronger volume, would improve the daily structure and could signal continuation of the recent uptrend.
🔴 Bearish Scenario
If FANG fails to hold $200 and continues moving lower, attention could shift toward $196–$194, where the MA(25) and MA(99) are positioned.
A sustained breakdown below this area would weaken the recent bullish structure and could expose the stock to deeper support levels around $187.
📌 Key Levels to Watch
🟢 Immediate support: $200
🟢 Major support zone: $194–$197
🟡 Lower support: $187
🔴 First resistance: $206–$208
🔥 Major resistance: $212.54
📈 Breakout trigger: Above $212.54 with strong volume
🚀 Final Outlook
FANG has delivered a strong recovery from the $181.85 area and recently reached $212.54, but the latest 5%+ decline shows that sellers are actively defending the higher levels.
The most important question now is whether the current move is simply a healthy pullback after a strong rally or the beginning of a deeper correction.
For the bulls, holding $200 and reclaiming $206–$208 would be an encouraging development. A break above $212.54 could then become the next major technical signal.
For the bears, a decisive loss of the $194–$197 support zone would significantly weaken the current recovery structure.
🔥 FANG is now at a key decision zone.
Do you think FANG will bounce from $200 and retest $212.54, or will sellers push it toward the $194–$197 support zone?
Drop your FANG target in the comments 👇
Like ❤️ if you want more 1D stock analysis.
Follow for more technical setups and key market levels.
FANG article ke liye ye hashtags best rahenge:
#FANG #DiamondbackEnergy #Stocks #StockMarket #StockAnalysis #TechnicalAnalysis #BinanceSquare
Agar short & clean rakhna hai:
#StockAnalysis #TechnicalAnalysis #stockmarket #BinanceSquare
$FANG.US