
The S&P 500 came under strong pressure last week as technology stocks sold off sharply and investors became increasingly concerned about high valuations and the massive amount of capital being committed to AI.
⠀
Now another major catalyst is approaching.
⠀
The U.S. midterm elections take place tomorrow, November 3, and $SPX is entering the event while sitting directly on an important technical support structure.
⠀
For me, this makes the next 24-48 hours especially important.
⠀
Can buyers defend the current Support Zone, or is a move below $7,500 coming next?
⠀
Why the Market Came Under Pressure
⠀
The recent weakness was not simply about one bad economic report.
⠀
Technology and AI-related stocks became the main source of pressure as investors started questioning whether the enormous spending on data centers, chips, and AI infrastructure will generate sufficient returns.
⠀
The S&P 500 Technology sector fell 6.8% during October, while Friday alone brought another sharp 4.2% decline.
⠀
That selling pressure pushed the broader S&P 500 lower and left the market technically much more vulnerable heading into election week.
⠀
U.S. Midterm Elections — What Matters for the Market?
⠀
Election uncertainty is now being added to an already fragile market.
⠀
The latest polling favors Democrats nationally, and analysts currently see them as having a good chance of taking control of the House.
⠀
The Senate remains much more difficult to predict.
⠀
For markets, I do not think the story is simply “Democrats bearish, Republicans bullish.”
⠀
Each scenario has different implications.
⠀
A Democratic sweep could increase expectations for stronger congressional oversight of AI companies, data centers, crypto, and other industries.
⠀
That could create additional uncertainty for technology stocks at a time when the AI trade is already under pressure.
⠀
A Republican sweep could initially reduce concerns about aggressive new regulation and support expectations for tax or defense-policy continuity.
⠀
However, it could also revive concerns about larger fiscal deficits and Treasury yields.
⠀
A divided Congress may limit major policy changes, which markets have historically sometimes viewed positively because political gridlock can reduce the probability of large legislative surprises.
⠀
So for me, the biggest short-term risk is not simply which party wins.
⠀
It is whether the result surprises the market.
⠀
History After Midterm Elections
⠀
Historically, U.S. equities have often performed well after midterm elections.
⠀
Since 1938, the S&P 500 has posted gains during the following 12 months in approximately 95% of midterm cycles, with average returns around 14%.
⠀
One explanation is that election uncertainty begins to disappear once the result is known.
⠀
But history does not guarantee what happens tomorrow.
⠀
The current market is dealing with unusually high technology valuations, AI spending concerns, elevated Treasury yields, and geopolitical uncertainty.
⠀
That is why I am paying more attention to the chart than to historical averages.
⠀
Technical Analysis
⠀
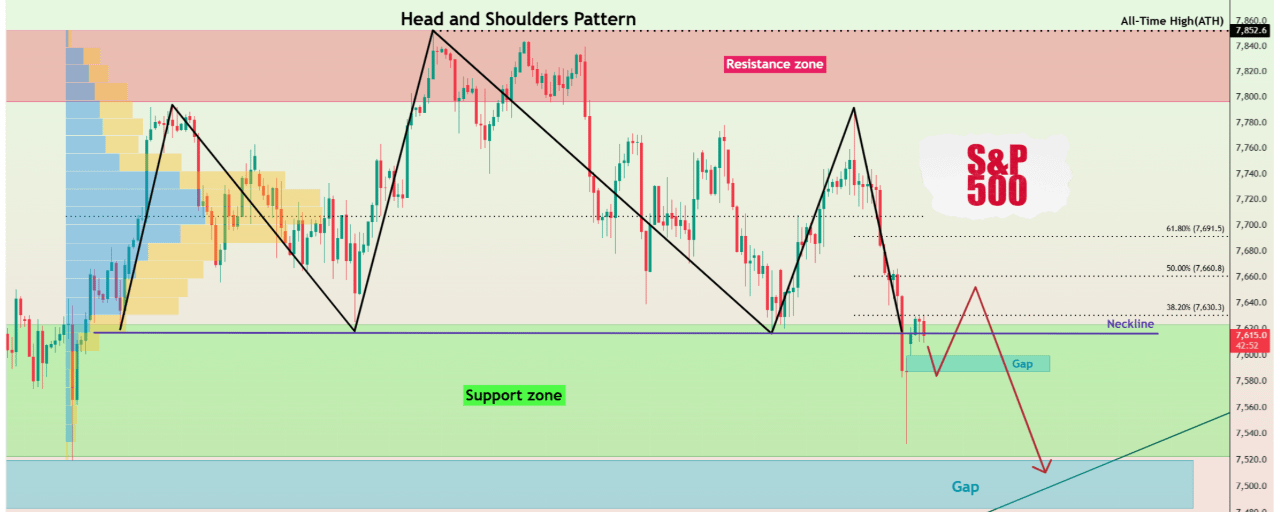
On the 4-hour timeframe, the S&P 500 is attempting to break below the important Support Zone ($7,523-$7,624).
⠀
A small bullish Gap also formed around ($7,587.7-$7,599.4), and I believe this gap could still be filled during a short-term reaction.
⠀
But the larger technical structure remains more concerning.
⠀
From a classical technical analysis perspective, the S&P 500 appears to have formed a clear Head and Shoulders Pattern.
⠀
The Right Shoulder developed with strong bearish momentum toward the Neckline, and price is now testing this critical structure.
⠀
For me, the Neckline is the key.
⠀
As long as buyers cannot recover strongly from this area, the bearish pattern remains active.
⠀
Bearish Scenario
⠀
My main scenario is that election volatility could create sharp moves in both directions before the market chooses its next trend.
⠀
However, a confirmed breakdown below the current Support Zone and Head and Shoulders Neckline would significantly strengthen the bearish setup.
⠀
The first downside target would be the larger Gap ($7,483.6-$7,519.7).
⠀
That area also brings the market close to the psychological $7,500 level and an important Support Line.
⠀
This combination makes approximately $7,500 one of the most important areas I am watching.
⠀
If $7,500 fails with strong bearish momentum, the correction could develop into something deeper rather than remaining a simple election-driven shakeout.
⠀
Bullish Scenario
⠀
There is also a bullish scenario that I do not want to ignore.
⠀
If buyers successfully defend the Support Zone ($7,523-$7,624), fill the smaller Gap, and reclaim the broken structure with strong momentum, the Head and Shoulders breakdown could fail.
⠀
That type of failed breakdown during a high-volatility event could force short sellers to cover and create a sharp relief rally.
⠀
For me, confirmation matters more than trying to predict the election result itself.
⠀
Trade Setup
⠀
Take Profit: $7,519
⠀
Stop Loss: $7,690
⠀
Key Trading Levels:
$7,500
$7,708
⠀
Support Zone:
($7,523-$7,624)
⠀
Small Gap:
($7,587.7-$7,599.4)
⠀
Main Downside Gap:
($7,483.6-$7,519.7)
⠀
Impact on $BTC and $ETH
⠀
This setup is also important for the crypto market.
⠀
Bitcoin and Ethereum remain sensitive to changes in broader risk sentiment, particularly when U.S. equities experience sharp moves.
⠀
If the S&P 500 breaks support and technology stocks come under another wave of selling, I would expect that Risk-Off environment to increase pressure on Bitcoin and Ethereum as well.
⠀
On the other hand, if election uncertainty fades and U.S. equities produce a strong relief rally, crypto could also receive some short-term support.
⠀
My S&P 500 Outlook
⠀
For me, the story is straightforward.
⠀
The market entered election week already weakened by the technology sell-off.
⠀
Now the S&P 500 is sitting on an important Support Zone while a potential Head and Shoulders Pattern is threatening to break its Neckline.
⠀
A short-term reaction is possible, especially around the election.
⠀
But unless buyers successfully reclaim the structure, I continue to see a meaningful risk of a move toward the ($7,483.6-$7,519.7) Gap and the psychological $7,500 area.
⠀
Election results could create False Breakouts and aggressive moves in both directions, so I would rather react to confirmation than predict the first candle.
⠀
Which level will the S&P 500 reach first?
⠀
🔴 $7,519
🟢 $7,690
⠀
#SP500

Artikel
S&P 500 at Major Support — Will the U.S. Midterms Trigger Another Sell-Off?