
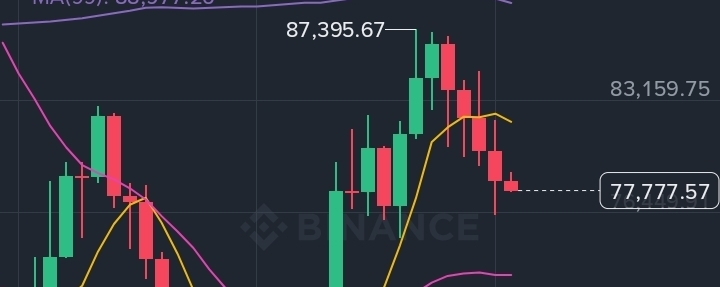

BTC is trading around $77,777, but the weekly chart is telling a much more interesting story.

Look closely. Something doesn't add up. 👇
🔥 THE WARNING SIGNS:
Bitcoin recently climbed toward $87,395.
Now it's falling back toward $77,777.
The weekly MA(7) is at $81,882 — Bitcoin is trading below it.
The MA(25) sits around $72,743.
Meanwhile, the MA(99) is near $88,977.
Three moving averages. Three different price zones. One massive question:
WHO IS REALLY IN CONTROL OF BITCOIN RIGHT NOW?
😨 HERE'S WHERE IT GETS INTERESTING…
The order book shows approximately:
🔴 Sellers: 52.38%
🟢 Buyers: 47.62%
Sellers currently have a slight advantage in this snapshot.
But does that mean Bitcoin is preparing for another drop?
Or are sellers simply creating the perfect opportunity for buyers to surprise everyone?
🎯 THE TWO SCENARIOS:
🐻 If Bitcoin loses the $72,700 area, bearish pressure could increase.
🐂 If Bitcoin recovers above $81,900, bullish momentum could return.
Neither scenario is confirmed yet.
⚡ NOW I HAVE ONE QUESTION FOR YOU:
Imagine waking up tomorrow and seeing BTC at $90,000…
Or waking up and finding it below $70,000.
Which scenario do you think is more likely?
👇 COMMENT YOUR PREDICTION:
$90K 🚀 OR $70K 🩸?
Let's see who understands Bitcoin's next move!
