AVA looks weak but the daily trend still points up
🔴 SHORT $AVA /USDT: expecting price to go DOWN
Bias: SHORT · Leaning
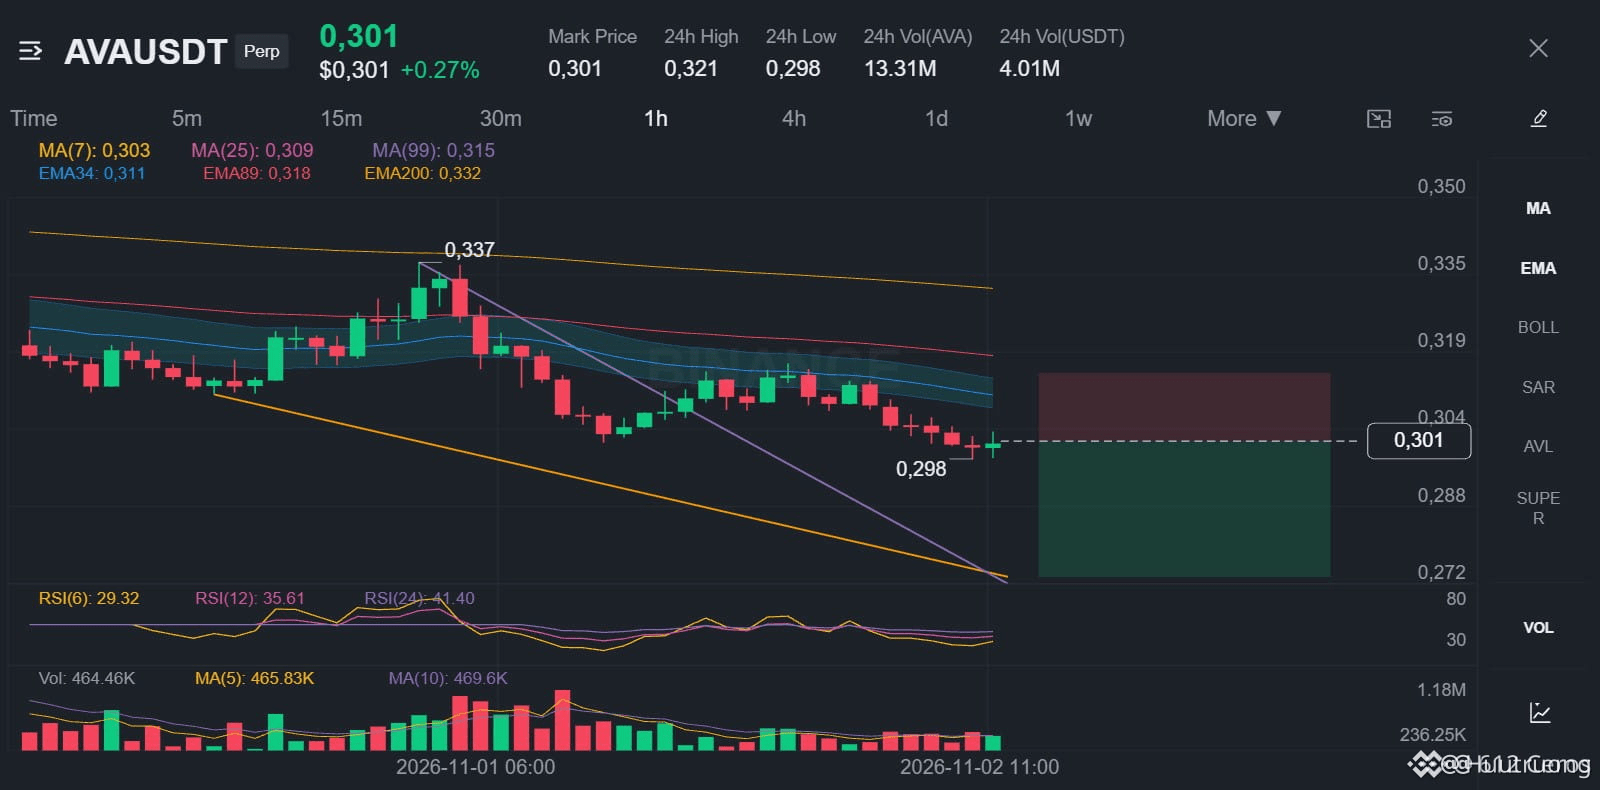
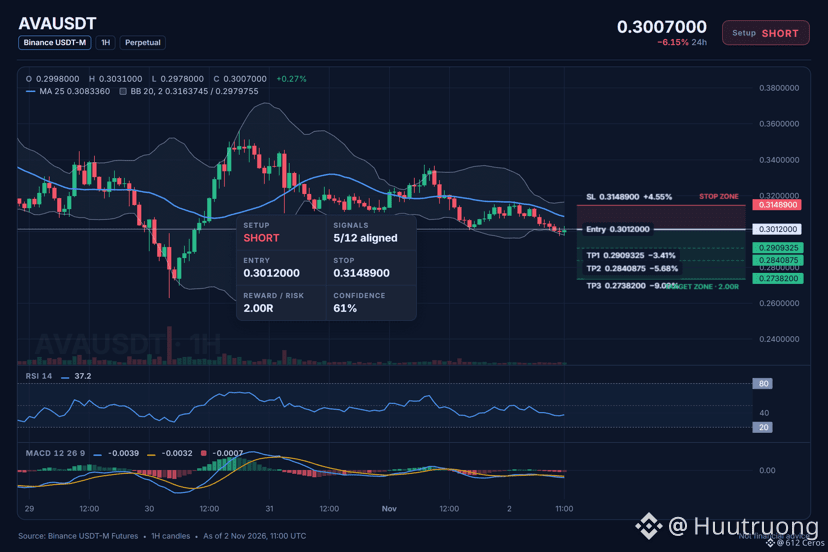
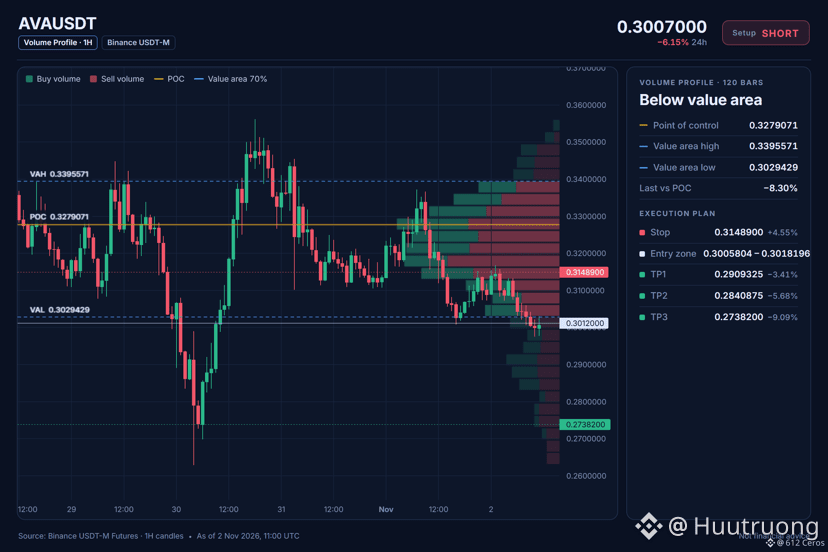
Entry: 0.3005804 – 0.3018196
TP1: 0.2909325 (-3.4%)
TP2: 0.2840875 (-5.7%)
TP3: 0.2738200 (-9.1%)
SL: 0.3148900 (+4.5%)
Plan: enter only inside the zone, close 50% at TP1, 25% at TP2, 25% at TP3, and move the stop to entry after TP1.
Caution: counter-trend idea backed by 5 signals only. Smaller size, hard stop.
Why SHORT? 5/12 signals agree, 1 against.
• 1h trend down (below EMA50 & EMA200)
• Sellers are driving the move (15m ADX 26.5)
• Sellers have the momentum (4h RSI 40.3)
Risk: Daily trend up (above EMA50 & EMA200)
Q: Why short when the daily trend is bullish?
A: The 1h trend is down with price below the EMA50 and EMA200.
Q: When is this short setup wrong?
A: If price breaks the daily EMA50 at 0.3148900, the trend reverses.
What level are you watching instead?
🔴 SHORT $AVA /USDT: expecting price to go DOWN
Bias: SHORT · Leaning
Entry: 0.3005804 – 0.3018196
TP1: 0.2909325 (-3.4%)
TP2: 0.2840875 (-5.7%)
TP3: 0.2738200 (-9.1%)
SL: 0.3148900 (+4.5%)
Plan: enter only inside the zone, close 50% at TP1, 25% at TP2, 25% at TP3, and move the stop to entry after TP1.
Caution: counter-trend idea backed by 5 signals only. Smaller size, hard stop.
Why SHORT? 5/12 signals agree, 1 against.
• 1h trend down (below EMA50 & EMA200)
• Sellers are driving the move (15m ADX 26.5)
• Sellers have the momentum (4h RSI 40.3)
Risk: Daily trend up (above EMA50 & EMA200)
Q: Why short when the daily trend is bullish?
A: The 1h trend is down with price below the EMA50 and EMA200.
Q: When is this short setup wrong?
A: If price breaks the daily EMA50 at 0.3148900, the trend reverses.
What level are you watching instead?