AIN (Infinity Ground) Cools Off After a Strong Rally. What the 4H Chart Is Saying
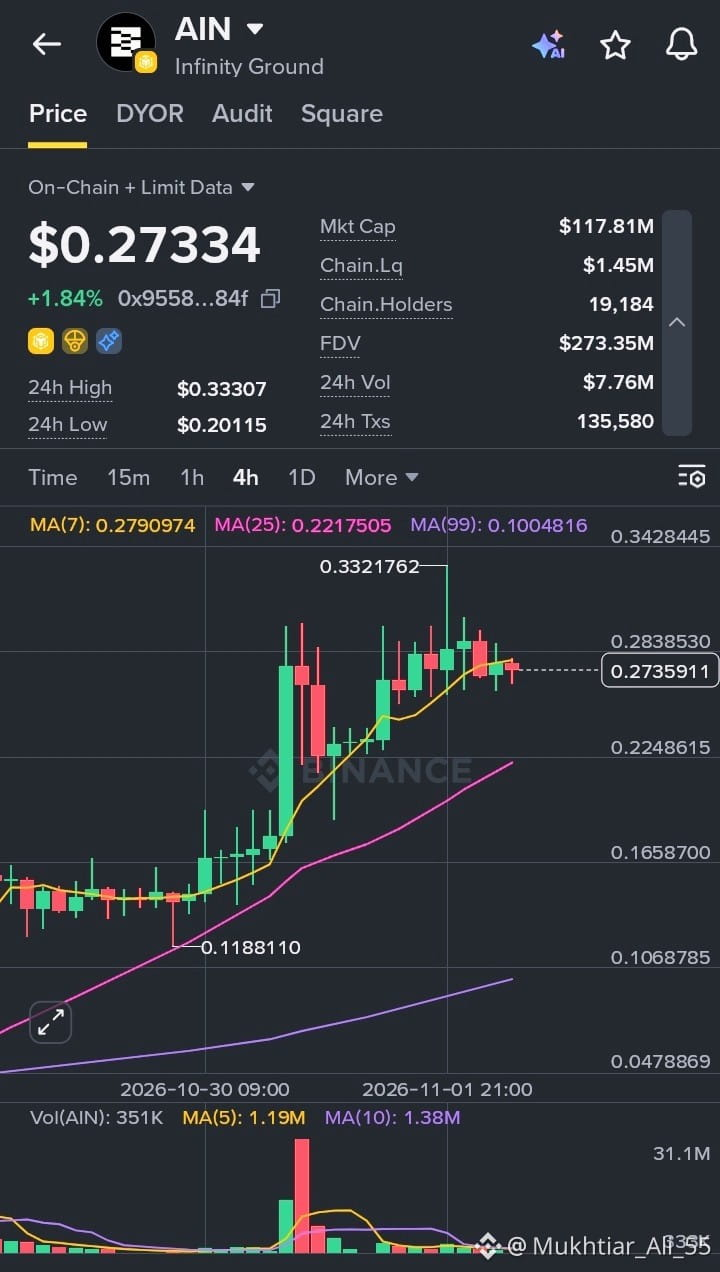
AIN has had quite a run lately, and the 4H chart is worth a closer look. After bottoming near $0.1188 around October 30, price climbed hard and tagged a high of about $0.3321 before pulling back. It’s now trading around $0.273, up roughly 1.84% on the day.
Key numbers at a glance
Price: $0.27334
Market Cap: $117.81M
FDV: $273.35M
24h Volume: $7.76M
24h High / Low: $0.33307 / $0.20115
On-chain holders: 19,184
24h Transactions: 135,580
What stands out on the chart
The big green candles with a clear volume spike marked the breakout, and buyers stepped in strongly at that stage. Since the peak, price has moved sideways in a tighter range, with smaller candles and fading volume. That usually signals consolidation rather than panic selling.
On the moving averages, price is sitting right around the MA(7) at roughly 0.279, which is acting as short-term resistance. MA(25) near 0.2217 is trending upward and could serve as the next support zone if the pullback deepens. MA(99) is still far below at about 0.10, which shows how sharp the recent move has been.
Things to keep in mind
Liquidity on-chain is about $1.45M against a market cap of $117M, which means price can swing quickly on larger orders. The FDV is also more than double the current market cap, so token unlocks and supply are worth tracking.
My take: Holding above the $0.22 to $0.25 area would keep the structure healthy, while a clean reclaim of the MA(7) with rising volume would be the first sign of renewed momentum. Until then, patience beats chasing candles.
#AIN #InfinityGround #CryptoAnalysis #AltcoinWatch #BinanceAlpha
$AIN
AIN has had quite a run lately, and the 4H chart is worth a closer look. After bottoming near $0.1188 around October 30, price climbed hard and tagged a high of about $0.3321 before pulling back. It’s now trading around $0.273, up roughly 1.84% on the day.
Key numbers at a glance
Price: $0.27334
Market Cap: $117.81M
FDV: $273.35M
24h Volume: $7.76M
24h High / Low: $0.33307 / $0.20115
On-chain holders: 19,184
24h Transactions: 135,580
What stands out on the chart
The big green candles with a clear volume spike marked the breakout, and buyers stepped in strongly at that stage. Since the peak, price has moved sideways in a tighter range, with smaller candles and fading volume. That usually signals consolidation rather than panic selling.
On the moving averages, price is sitting right around the MA(7) at roughly 0.279, which is acting as short-term resistance. MA(25) near 0.2217 is trending upward and could serve as the next support zone if the pullback deepens. MA(99) is still far below at about 0.10, which shows how sharp the recent move has been.
Things to keep in mind
Liquidity on-chain is about $1.45M against a market cap of $117M, which means price can swing quickly on larger orders. The FDV is also more than double the current market cap, so token unlocks and supply are worth tracking.
My take: Holding above the $0.22 to $0.25 area would keep the structure healthy, while a clean reclaim of the MA(7) with rising volume would be the first sign of renewed momentum. Until then, patience beats chasing candles.
#AIN #InfinityGround #CryptoAnalysis #AltcoinWatch #BinanceAlpha
$AIN