🚀 $GTC Is Back in Motion! Can Buyers Push Beyond $0.256? ⚡
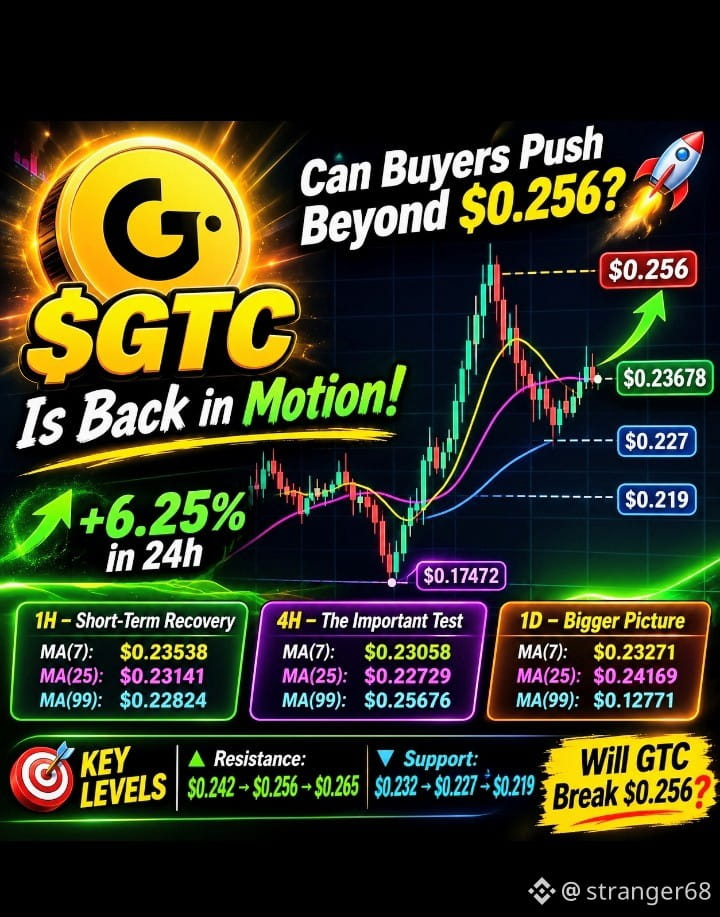
📈 GTC is showing renewed strength, trading around $0.23678, up 6.25% in 24 hours. After recovering from the sharp drop toward $0.17472, price is attempting to build a stronger base. But the next move will depend on whether buyers can overcome the higher-timeframe resistance. 🔥
⚡ 1H — Short-Term Recovery
- Price: $0.23678
- MA(7): $0.23538
- MA(25): $0.23141
- MA(99): $0.22824
Price is holding above all three moving averages, keeping the short-term structure constructive. However, MACD is showing some cooling momentum, so a brief consolidation would not be surprising.
📊 4H — The Important Test
- MA(7): $0.23058
- MA(25): $0.22729
- MA(99): $0.25676
The recovery remains intact, but the $0.256–$0.257 zone is a major hurdle. A convincing 4H close above this area could open the door toward $0.265.
🌍 1D — Bigger Picture
The daily chart shows a strong rally followed by a significant correction. Price is holding above the daily MA(7) at $0.23271, but remains below MA(25) at $0.24169.
A daily close above $0.242 would strengthen the recovery. Failure to hold current levels could bring another support test.
🎯 KEY LEVELS TO WATCH
🟢 Resistance: $0.242 → $0.256 → $0.265
🔵 Support: $0.232 → $0.227 → $0.219
🔥 THE TRADE SETUP
A breakout above $0.256 with strong volume could attract fresh buying interest. On the other hand, losing $0.227 may weaken the recovery and expose lower support.
💬 What's your view? Can buyers take GTC above $0.256, or will sellers defend this level again? Share your trading strategy below! 🚀
#GTC #CryptoTrading #BinanceSquare
#BinanceToResumePhaseOneOfWithdrawals #IntelHasItsWorstDaySince1974 #BinanceUpdatesProofofReservesAddresses #CZDismissesClaimsBinanceHackWasPredicted
📈 GTC is showing renewed strength, trading around $0.23678, up 6.25% in 24 hours. After recovering from the sharp drop toward $0.17472, price is attempting to build a stronger base. But the next move will depend on whether buyers can overcome the higher-timeframe resistance. 🔥
⚡ 1H — Short-Term Recovery
- Price: $0.23678
- MA(7): $0.23538
- MA(25): $0.23141
- MA(99): $0.22824
Price is holding above all three moving averages, keeping the short-term structure constructive. However, MACD is showing some cooling momentum, so a brief consolidation would not be surprising.
📊 4H — The Important Test
- MA(7): $0.23058
- MA(25): $0.22729
- MA(99): $0.25676
The recovery remains intact, but the $0.256–$0.257 zone is a major hurdle. A convincing 4H close above this area could open the door toward $0.265.
🌍 1D — Bigger Picture
The daily chart shows a strong rally followed by a significant correction. Price is holding above the daily MA(7) at $0.23271, but remains below MA(25) at $0.24169.
A daily close above $0.242 would strengthen the recovery. Failure to hold current levels could bring another support test.
🎯 KEY LEVELS TO WATCH
🟢 Resistance: $0.242 → $0.256 → $0.265
🔵 Support: $0.232 → $0.227 → $0.219
🔥 THE TRADE SETUP
A breakout above $0.256 with strong volume could attract fresh buying interest. On the other hand, losing $0.227 may weaken the recovery and expose lower support.
💬 What's your view? Can buyers take GTC above $0.256, or will sellers defend this level again? Share your trading strategy below! 🚀
#GTC #CryptoTrading #BinanceSquare
#BinanceToResumePhaseOneOfWithdrawals #IntelHasItsWorstDaySince1974 #BinanceUpdatesProofofReservesAddresses #CZDismissesClaimsBinanceHackWasPredicted