LAB is a counter-trend long against the daily bearish stack.
🟢 LONG $LAB /USDT: expecting price to go UP
Bias: LONG · Leaning
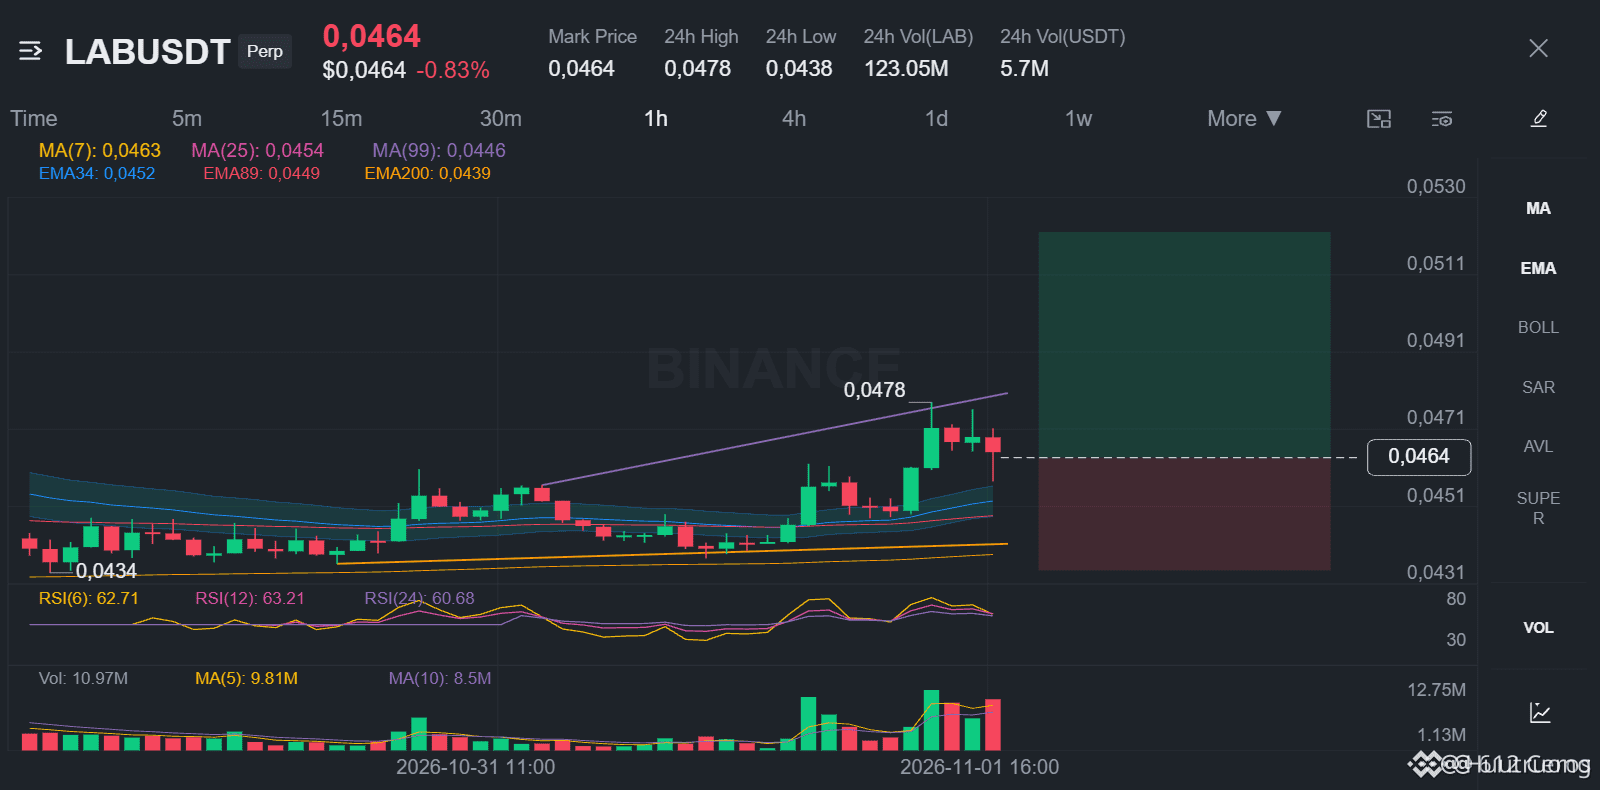
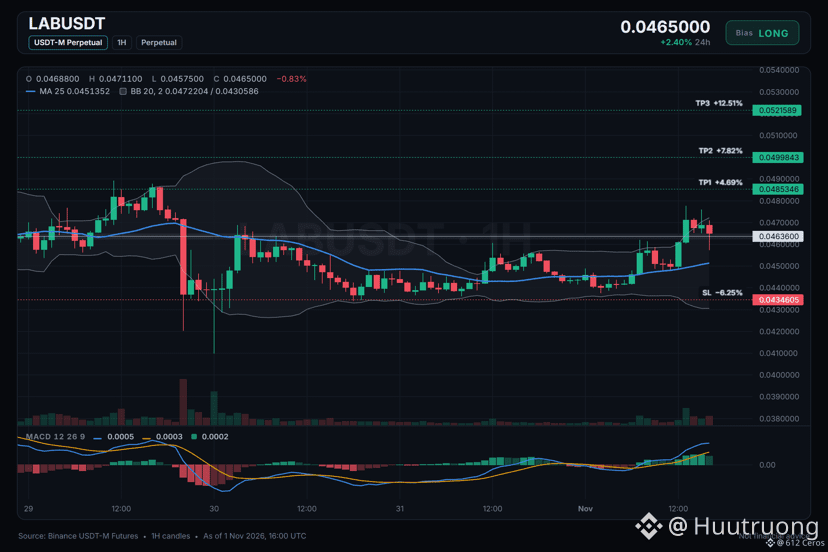
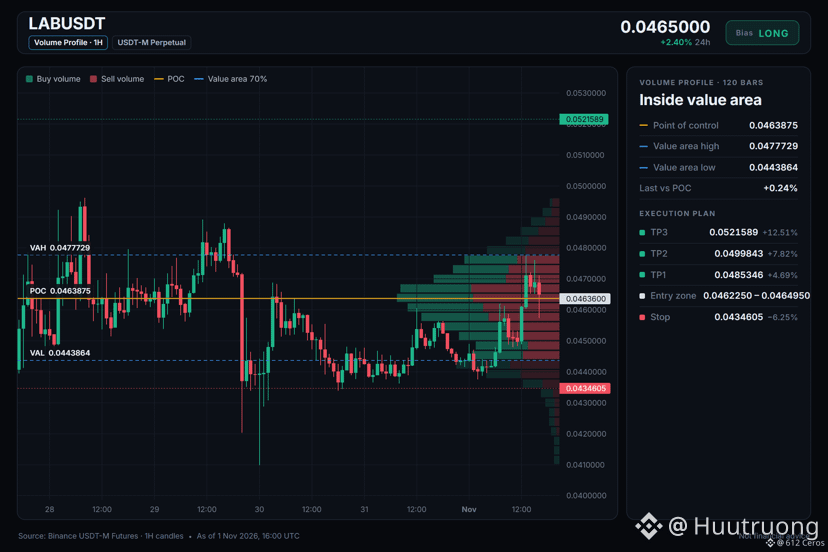
Entry: 0.0462250 – 0.0464950
TP1: 0.0485346 (+4.7%)
TP2: 0.0499843 (+7.8%)
TP3: 0.0521589 (+12.5%)
SL: 0.0434605 (-6.3%)
Plan: enter only inside the zone, close 50% at TP1, 25% at TP2, 25% at TP3, and move the stop to entry after TP1.
Caution: counter-trend idea backed by 5 signals only. Smaller size, hard stop.
Why LONG? 5/12 signals agree, 1 against.
• 1h trend up (above EMA50 & EMA200)
• Buyers are driving the move (15m ADX 26.1)
• Buyers have the momentum (4h RSI 59.2)
Risk: Daily trend down (below EMA50 & EMA200)
Plan A:
If the short-term move holds, the 1h trend shows buyers stacking above EMA50 and EMA200, which could lift price toward the entry area of 0.0462250 to 0.0464950 and beyond.
Plan B (invalidation):
A daily close below the invalidation level of 0.0434605 would prove the daily bearish stack is intact, so I would exit immediately.
Where would you place your stop for this LAB long?
🟢 LONG $LAB /USDT: expecting price to go UP
Bias: LONG · Leaning
Entry: 0.0462250 – 0.0464950
TP1: 0.0485346 (+4.7%)
TP2: 0.0499843 (+7.8%)
TP3: 0.0521589 (+12.5%)
SL: 0.0434605 (-6.3%)
Plan: enter only inside the zone, close 50% at TP1, 25% at TP2, 25% at TP3, and move the stop to entry after TP1.
Caution: counter-trend idea backed by 5 signals only. Smaller size, hard stop.
Why LONG? 5/12 signals agree, 1 against.
• 1h trend up (above EMA50 & EMA200)
• Buyers are driving the move (15m ADX 26.1)
• Buyers have the momentum (4h RSI 59.2)
Risk: Daily trend down (below EMA50 & EMA200)
Plan A:
If the short-term move holds, the 1h trend shows buyers stacking above EMA50 and EMA200, which could lift price toward the entry area of 0.0462250 to 0.0464950 and beyond.
Plan B (invalidation):
A daily close below the invalidation level of 0.0434605 would prove the daily bearish stack is intact, so I would exit immediately.
Where would you place your stop for this LAB long?