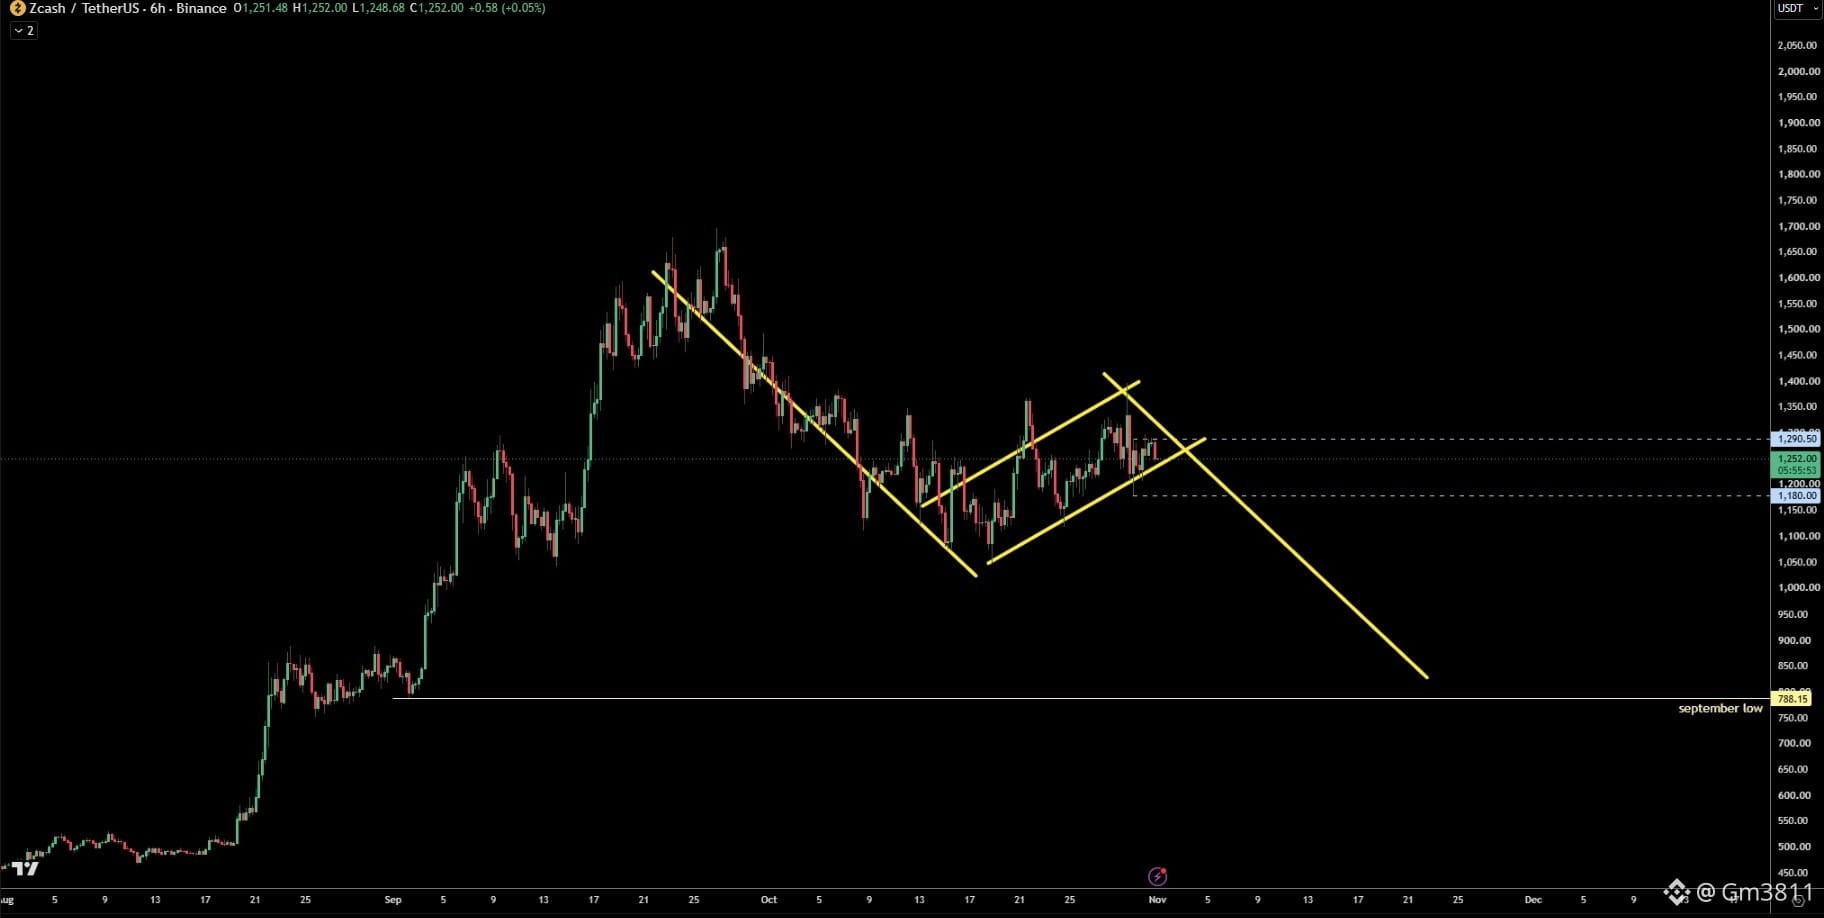
$ZEC is showing what looks like a potential bear flag. 📉
Now, chart patterns alone don't mean much. You can draw lines around almost any price action to fit a bias or push an agenda.
But context matters.
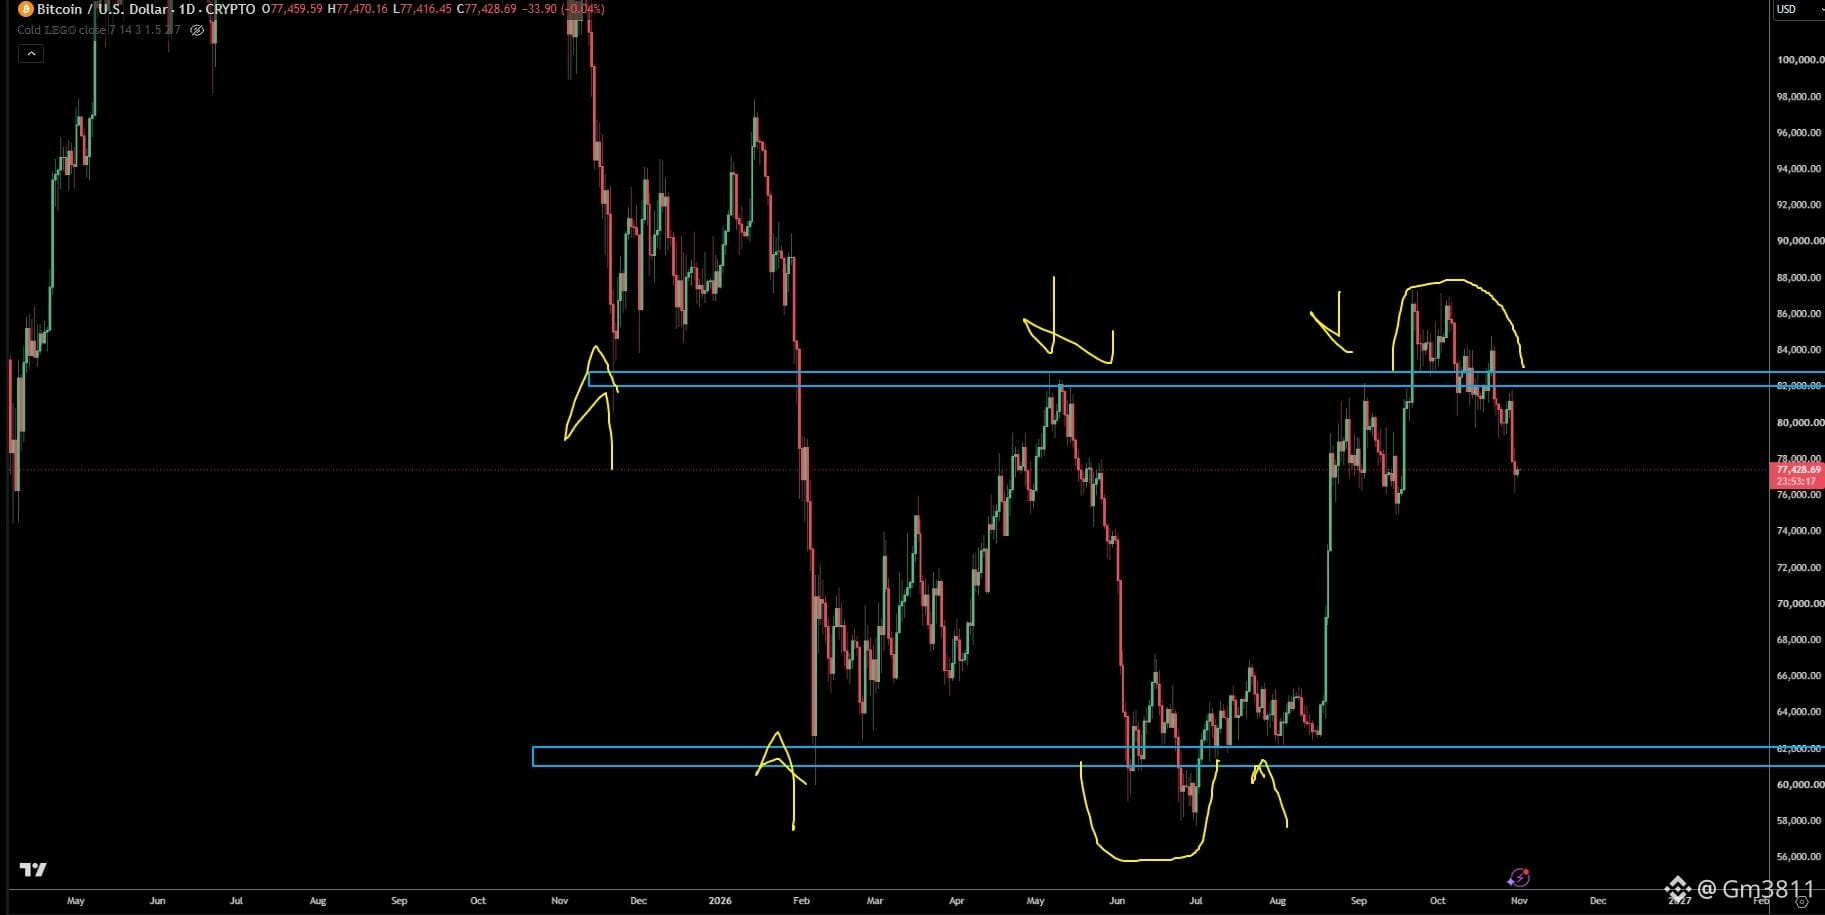
When you combine ZEC's current structure with what $BTC is doing, the bearish setup becomes harder to ignore.
If Bitcoin remains under pressure, ZEC could struggle to hold its consolidation and face another leg down.
The key is confirmation, not assumptions.
👀 Is this a genuine bear flag, or are traders reading too much into the chart?