

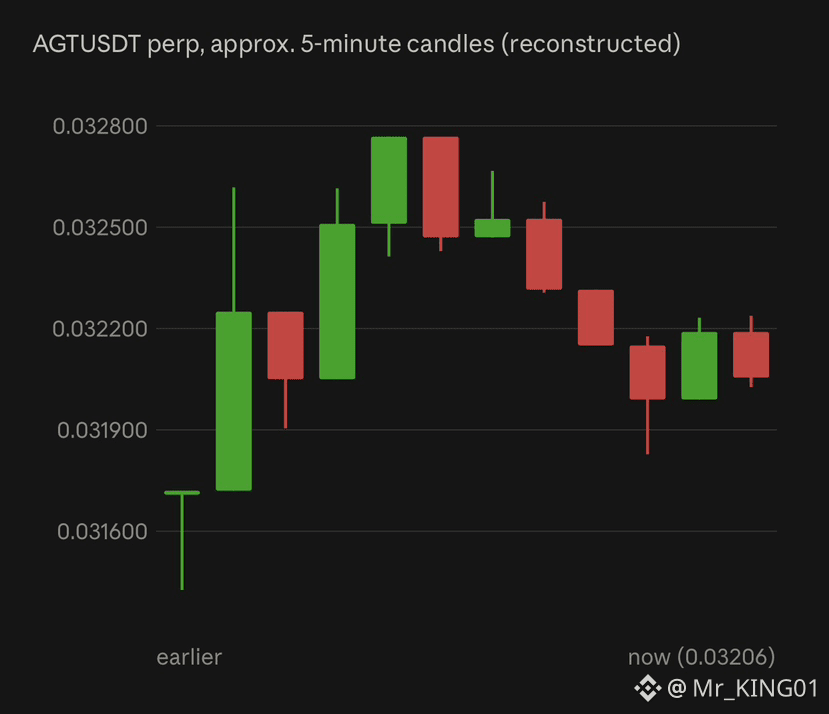
$AGT is trading at 0.03206 USDT with a mark price of 0.03202. It is down 10.20% in 24h (-9.46% “Today”), with a range of 0.02992–0.03741 and about 10.84M USDT (330.37M AGT) in volume. That is about 58% below the 0.075573 level in your earlier AGT screenshot. The short-term picture is weak: -59.38% over 7 days. Longer periods remain strongly positive: +34.83% over 30 days, +96.42% over 90 days, +82.56% over 180 days and +712.67% over 1 year. In the visible window, price jumped from about 0.03143 to a peak near 0.03277, faded back to about 0.03183, and has since recovered partway. It is just below the MA60 (0.032183), which is sloping up and now acting as resistance, and the order book is balanced with a slight buyer lean (51.74% bids vs 48.26% asks). Support is near 0.03183, then the 24h low of 0.02992, and resistance is at the MA60 (0.03218), then 0.0327 and the 24h high of 0.03741. A close above the MA60 would be the first sign the decline is easing, while a break below 0.02992 would set a new 24h low. After a drop this large, a leveraged perp can swing sharply in either direction.
Krypto-Nutzer weltweit auf Binance Square kennenlernen
⚡️ Bleib in Sachen Krypto stets am Puls.
💬 Die weltgrößte Kryptobörse vertraut darauf.
👍 Erhalte verlässliche Einblicke von verifizierten Creators.
E-Mail-Adresse/Telefonnummer