$SOL $BTC $ETH
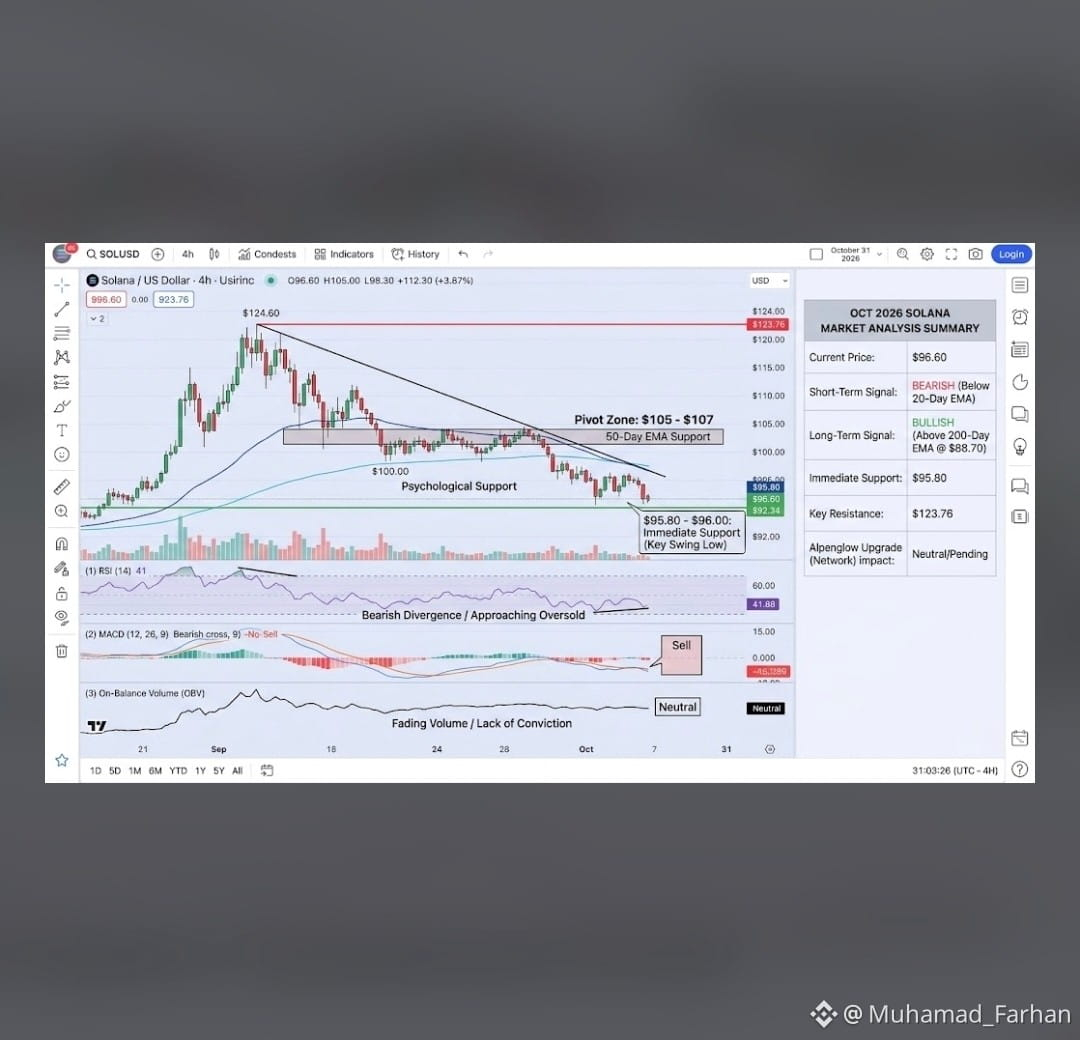
Here is a technical market breakdown for Solana ($SOL ) based on late-October 2026 price action, accompanied by a visual chart
Visual Technical Chart Layout
SOL/USDT 4H / DAILY TECHNICAL PRICE (USD) $125.00 [Major Resistance] (Sept High) | / $120.00 / [Trendline Resistance] | / $115.00 + 20-EMA --/--- [Pivot Zone: $114-$116] | / $110.00 + (Weak Overhead Supply) | / $105.00 [IMMEDIATE ACCUMULATION ZONE] [Pivot: $105 - $107] | [Psychological Support] [Key Swing Low] [200-Day EMA INDICATORS & RSI (14-Day) : [ 29 - 41 ] --> Fading Momentum / Approaching Oversold Territory MACD : [ Bearish ] --> Signal Line cross intact, Histogram negative Volume (OBV) : [ Neutral ] --> Flat volume profile, consolidation
1. Key Technical Levels
Current Price Action: is trading in the range of $96.00 – $106.00, following rejection from its late September peak near $124.60.
Immediate Support Zone ($100 – $105): Holds the 50-day EMA and major structural Fibonacci confluence. A drop below this zone exposes the key swing low near $95.80 – $96.00.
Macro Base ($87.50 – $88.70): The 200-day EMA acts as the primary macro bull/bear boundary.
Overhead Resistance ($114 – $116): The immediate obstacle for bulls, guarded by the 20-day EMA. Clearing this level opens a path toward the main trendline resistance at $120 – $124.50
2. Technical Momentum & Indicators
RSI (14): Oscillating near lower neutral-to-oversold bounds (~30 – 41), indicating seller dominance, though momentum is stretching near potential short-term bounce levelsMoving Averages: Price sits below the 20-day EMA (~$115.10) but remains above the 200-day SMA (~$88.70), reflecting short-term consolidation within a broader macro neutral-to-bullish framework.
Volume Profile (OBV): Flat On-Balance Volume highlights low conviction from both buyers and sellers, signaling a high-probability breakout setup as volatility contracts.
3. Trade Execution Scenarios
Bullish Reversal (Long Setup):
Hold & reclaim of $105.50 – $107.00
#Binance #BTC #ETH #sol #Saga