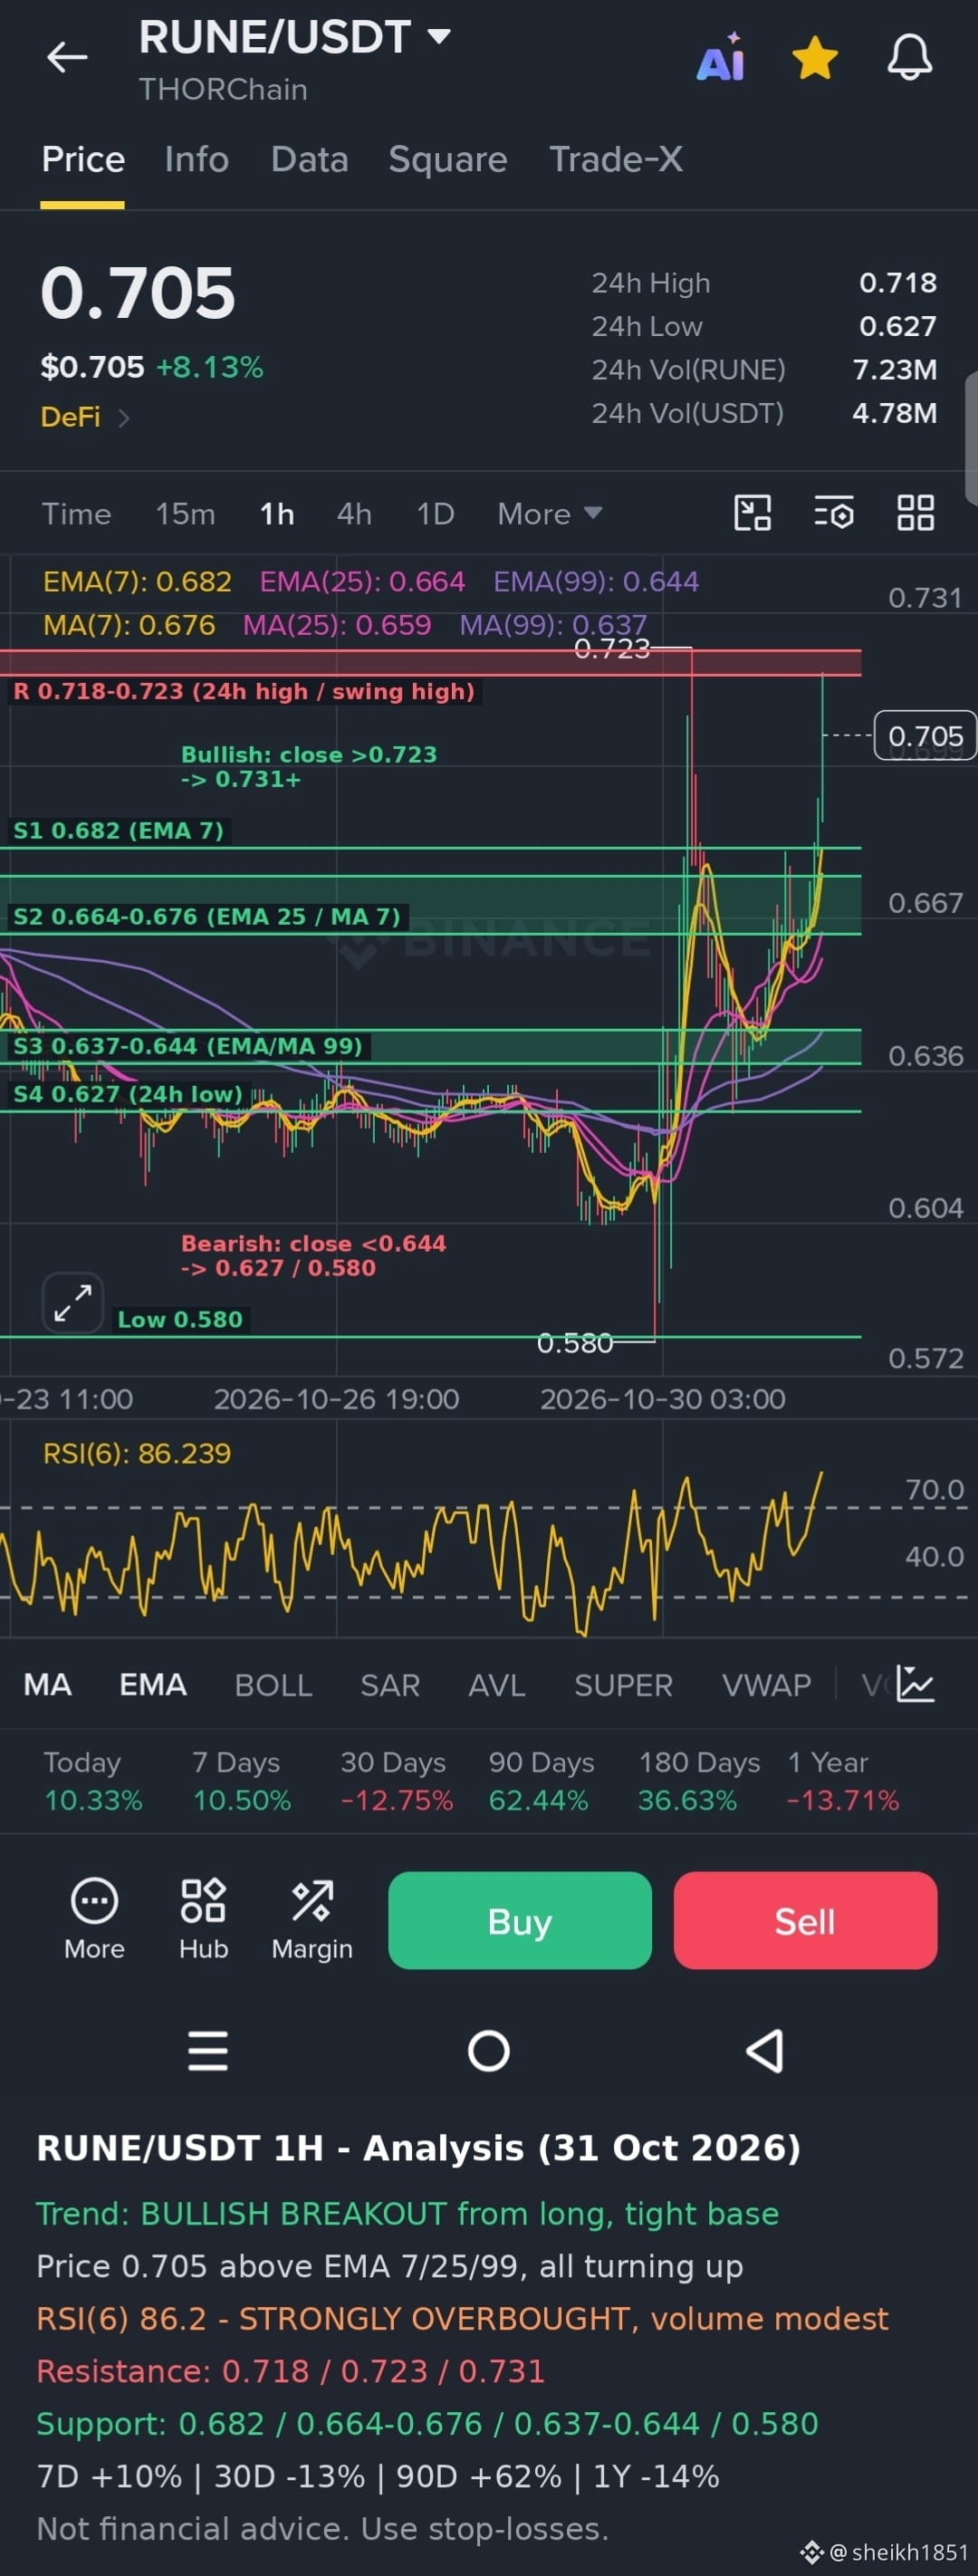
$RUNE **RUNE/USDT (1H) – Quick Analysis**
**Trend:** Bullish breakout after a long, tight base. Price (0.705) is above EMA(7) 0.682, EMA(25) 0.664 and EMA(99) 0.644, with the averages stacked in bullish order and all turning up. It spent days compressed around 0.62 to 0.65, spiked to 0.723, pulled back to about 0.65 and made a higher low, then pushed to new highs near 0.718. It is up about 10% over 7 days and 62% over 90 days, but down about 13% over 30 days and 14% over one year, so this is a recovery inside a longer weak period.
**Momentum:** RSI(6) is about 86, which is strongly overbought. Price is also about 3% above EMA(7), so it is stretched. Moves like this often pause or retrace before any continuation. Volume is modest (about 4.8M USDT) for a +8% day, so the breakout needs more participation to hold.
**Key levels:**
- **Resistance:** 0.718 (24h high), then 0.723 (the earlier swing high). A break above 0.723 would leave little overhead resistance on this chart, up to 0.731 and beyond.
- **Support:** 0.682 (EMA 7), then 0.664 to 0.676 (EMA/MA 25 and MA 7), then 0.637 to 0.644 (EMA/MA 99). Below that, 0.627 (24h low) and 0.580 (the flush low).
**Outlook:** The bias is bullish while price holds above 0.664. A 1H close above 0.723 with rising volume could extend the breakout. With RSI this high, a pullback to 0.676 to 0.682 would be a normal reset and a better entry area than chasing. A close below 0.644 would break the structure and point back toward 0.627.
This is a technical read not financial advice. Use stop-losses and keep position sizes small.
#Binance #Rune
**Trend:** Bullish breakout after a long, tight base. Price (0.705) is above EMA(7) 0.682, EMA(25) 0.664 and EMA(99) 0.644, with the averages stacked in bullish order and all turning up. It spent days compressed around 0.62 to 0.65, spiked to 0.723, pulled back to about 0.65 and made a higher low, then pushed to new highs near 0.718. It is up about 10% over 7 days and 62% over 90 days, but down about 13% over 30 days and 14% over one year, so this is a recovery inside a longer weak period.
**Momentum:** RSI(6) is about 86, which is strongly overbought. Price is also about 3% above EMA(7), so it is stretched. Moves like this often pause or retrace before any continuation. Volume is modest (about 4.8M USDT) for a +8% day, so the breakout needs more participation to hold.
**Key levels:**
- **Resistance:** 0.718 (24h high), then 0.723 (the earlier swing high). A break above 0.723 would leave little overhead resistance on this chart, up to 0.731 and beyond.
- **Support:** 0.682 (EMA 7), then 0.664 to 0.676 (EMA/MA 25 and MA 7), then 0.637 to 0.644 (EMA/MA 99). Below that, 0.627 (24h low) and 0.580 (the flush low).
**Outlook:** The bias is bullish while price holds above 0.664. A 1H close above 0.723 with rising volume could extend the breakout. With RSI this high, a pullback to 0.676 to 0.682 would be a normal reset and a better entry area than chasing. A close below 0.644 would break the structure and point back toward 0.627.
This is a technical read not financial advice. Use stop-losses and keep position sizes small.
#Binance #Rune