The $BTC Positioning Gap That Worries Me 🔍
TL;DR: Top traders more bearish than the crowd; 73% of accounts are long. History leans down (1/5). Price 77,497.6, daily RSI 34.
🔍 What the numbers show
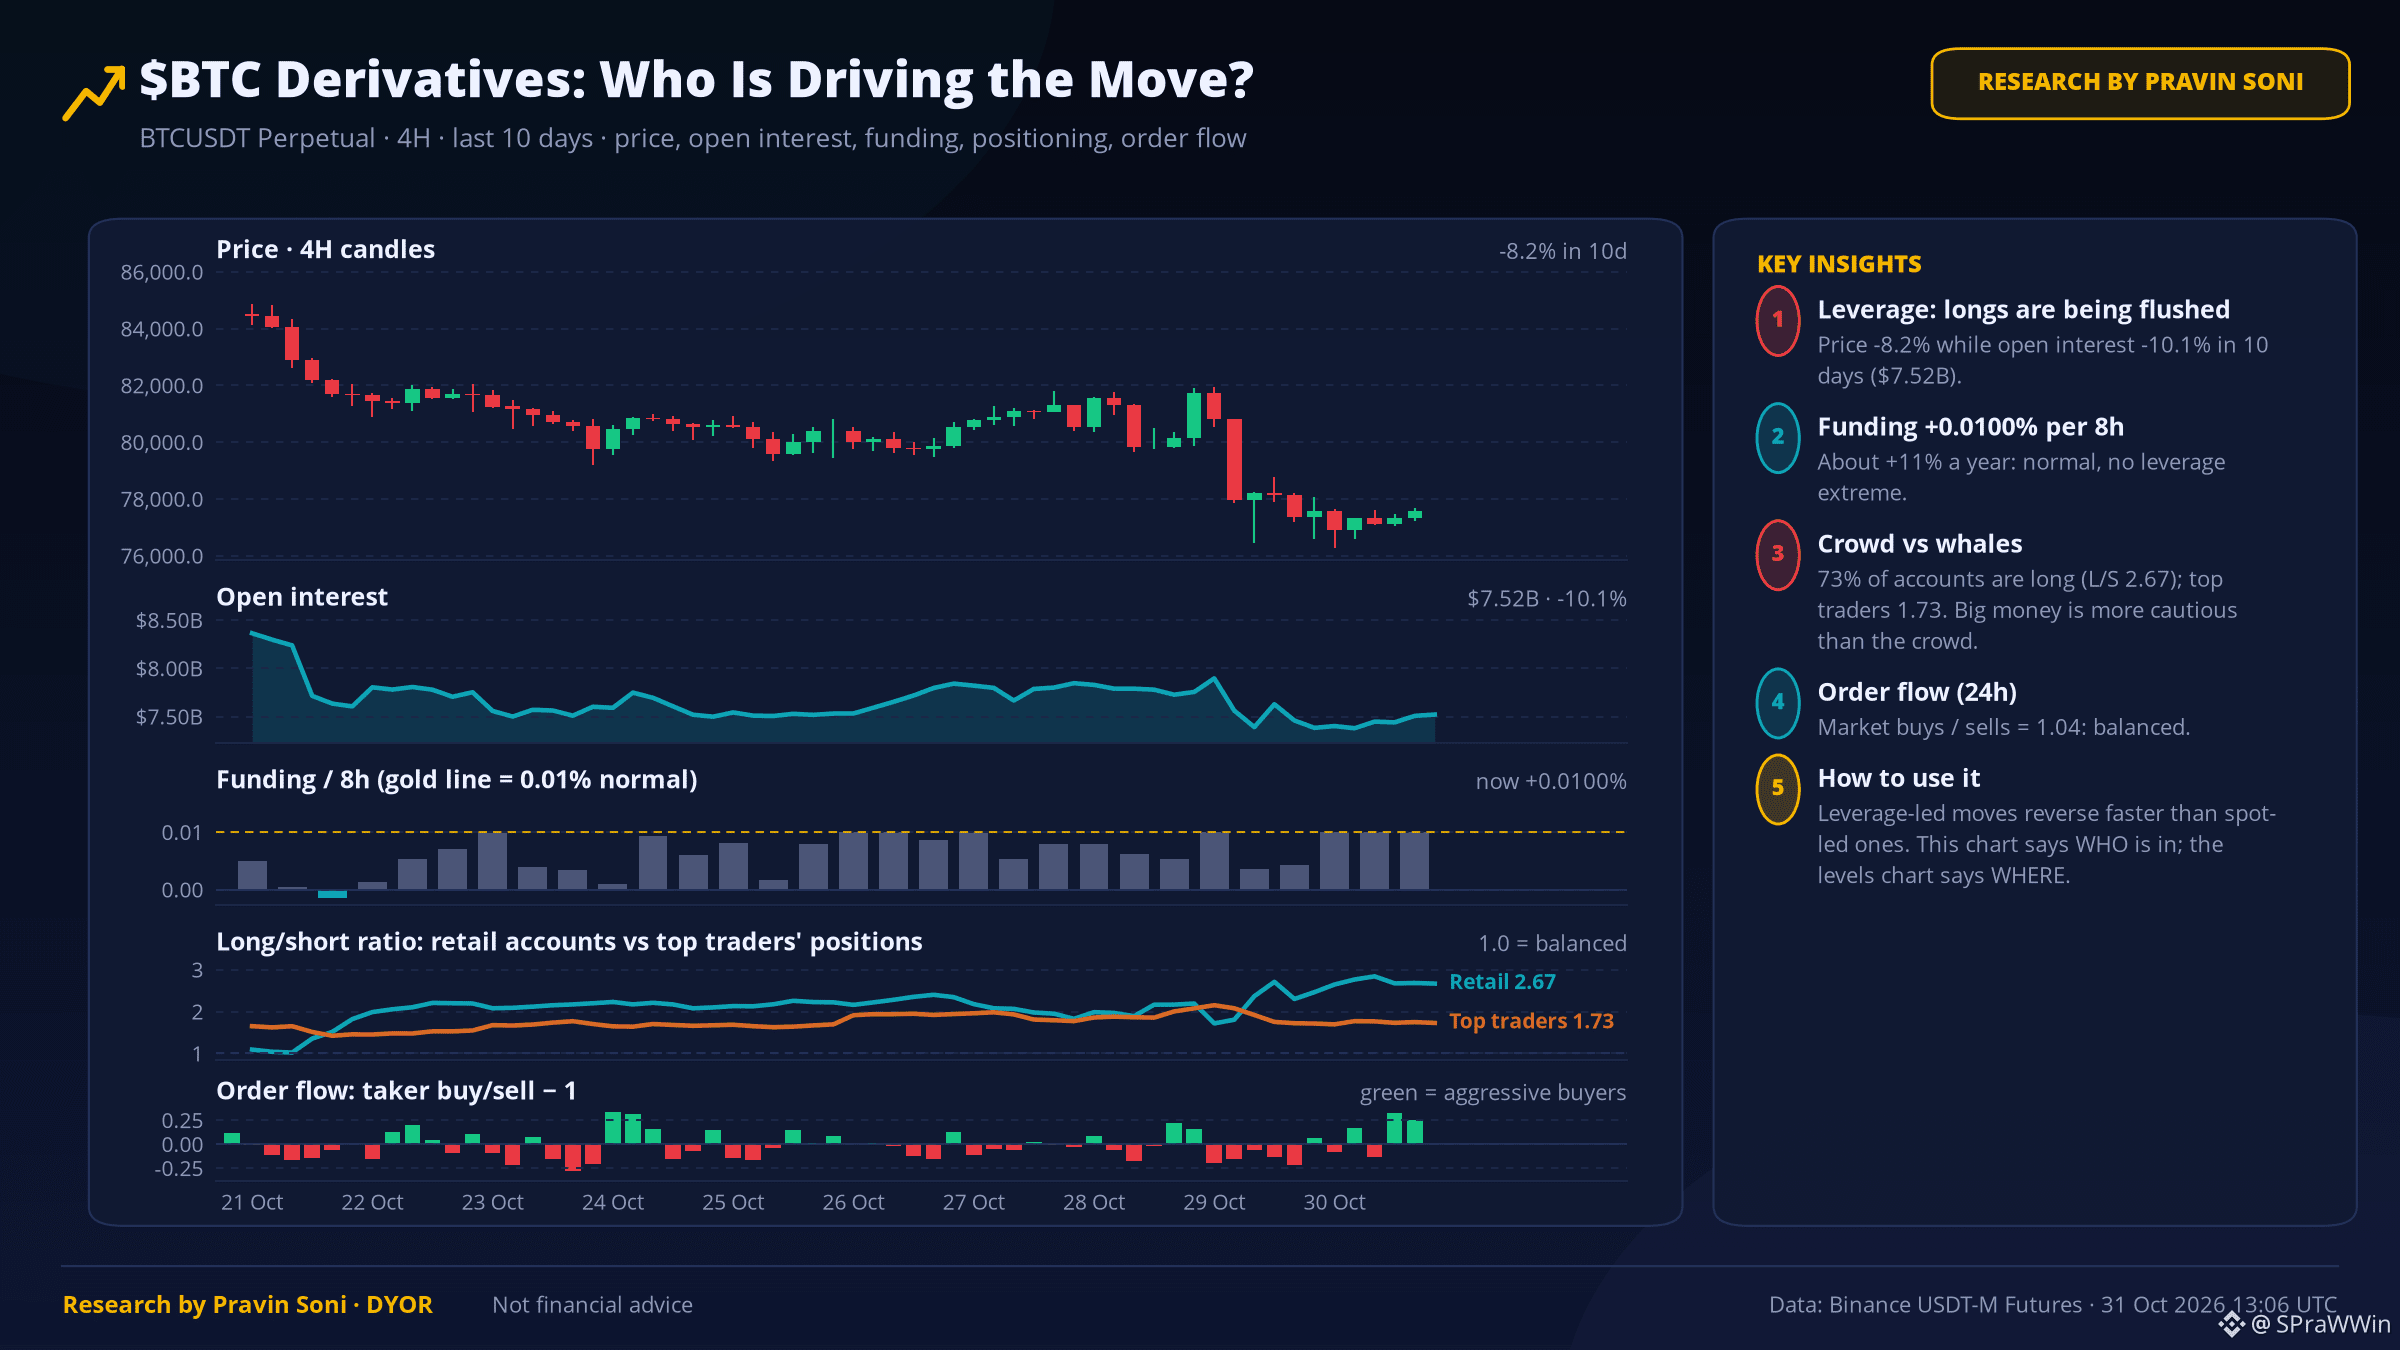
1️⃣ Top traders' position ratio is 1.72 vs their account ratio 2.80 — big money is leaning short.
2️⃣ 73% of Binance accounts are long (L/S 2.64) — the crowd is one-sided, a contrarian warning.
⏪ Has this happened before?
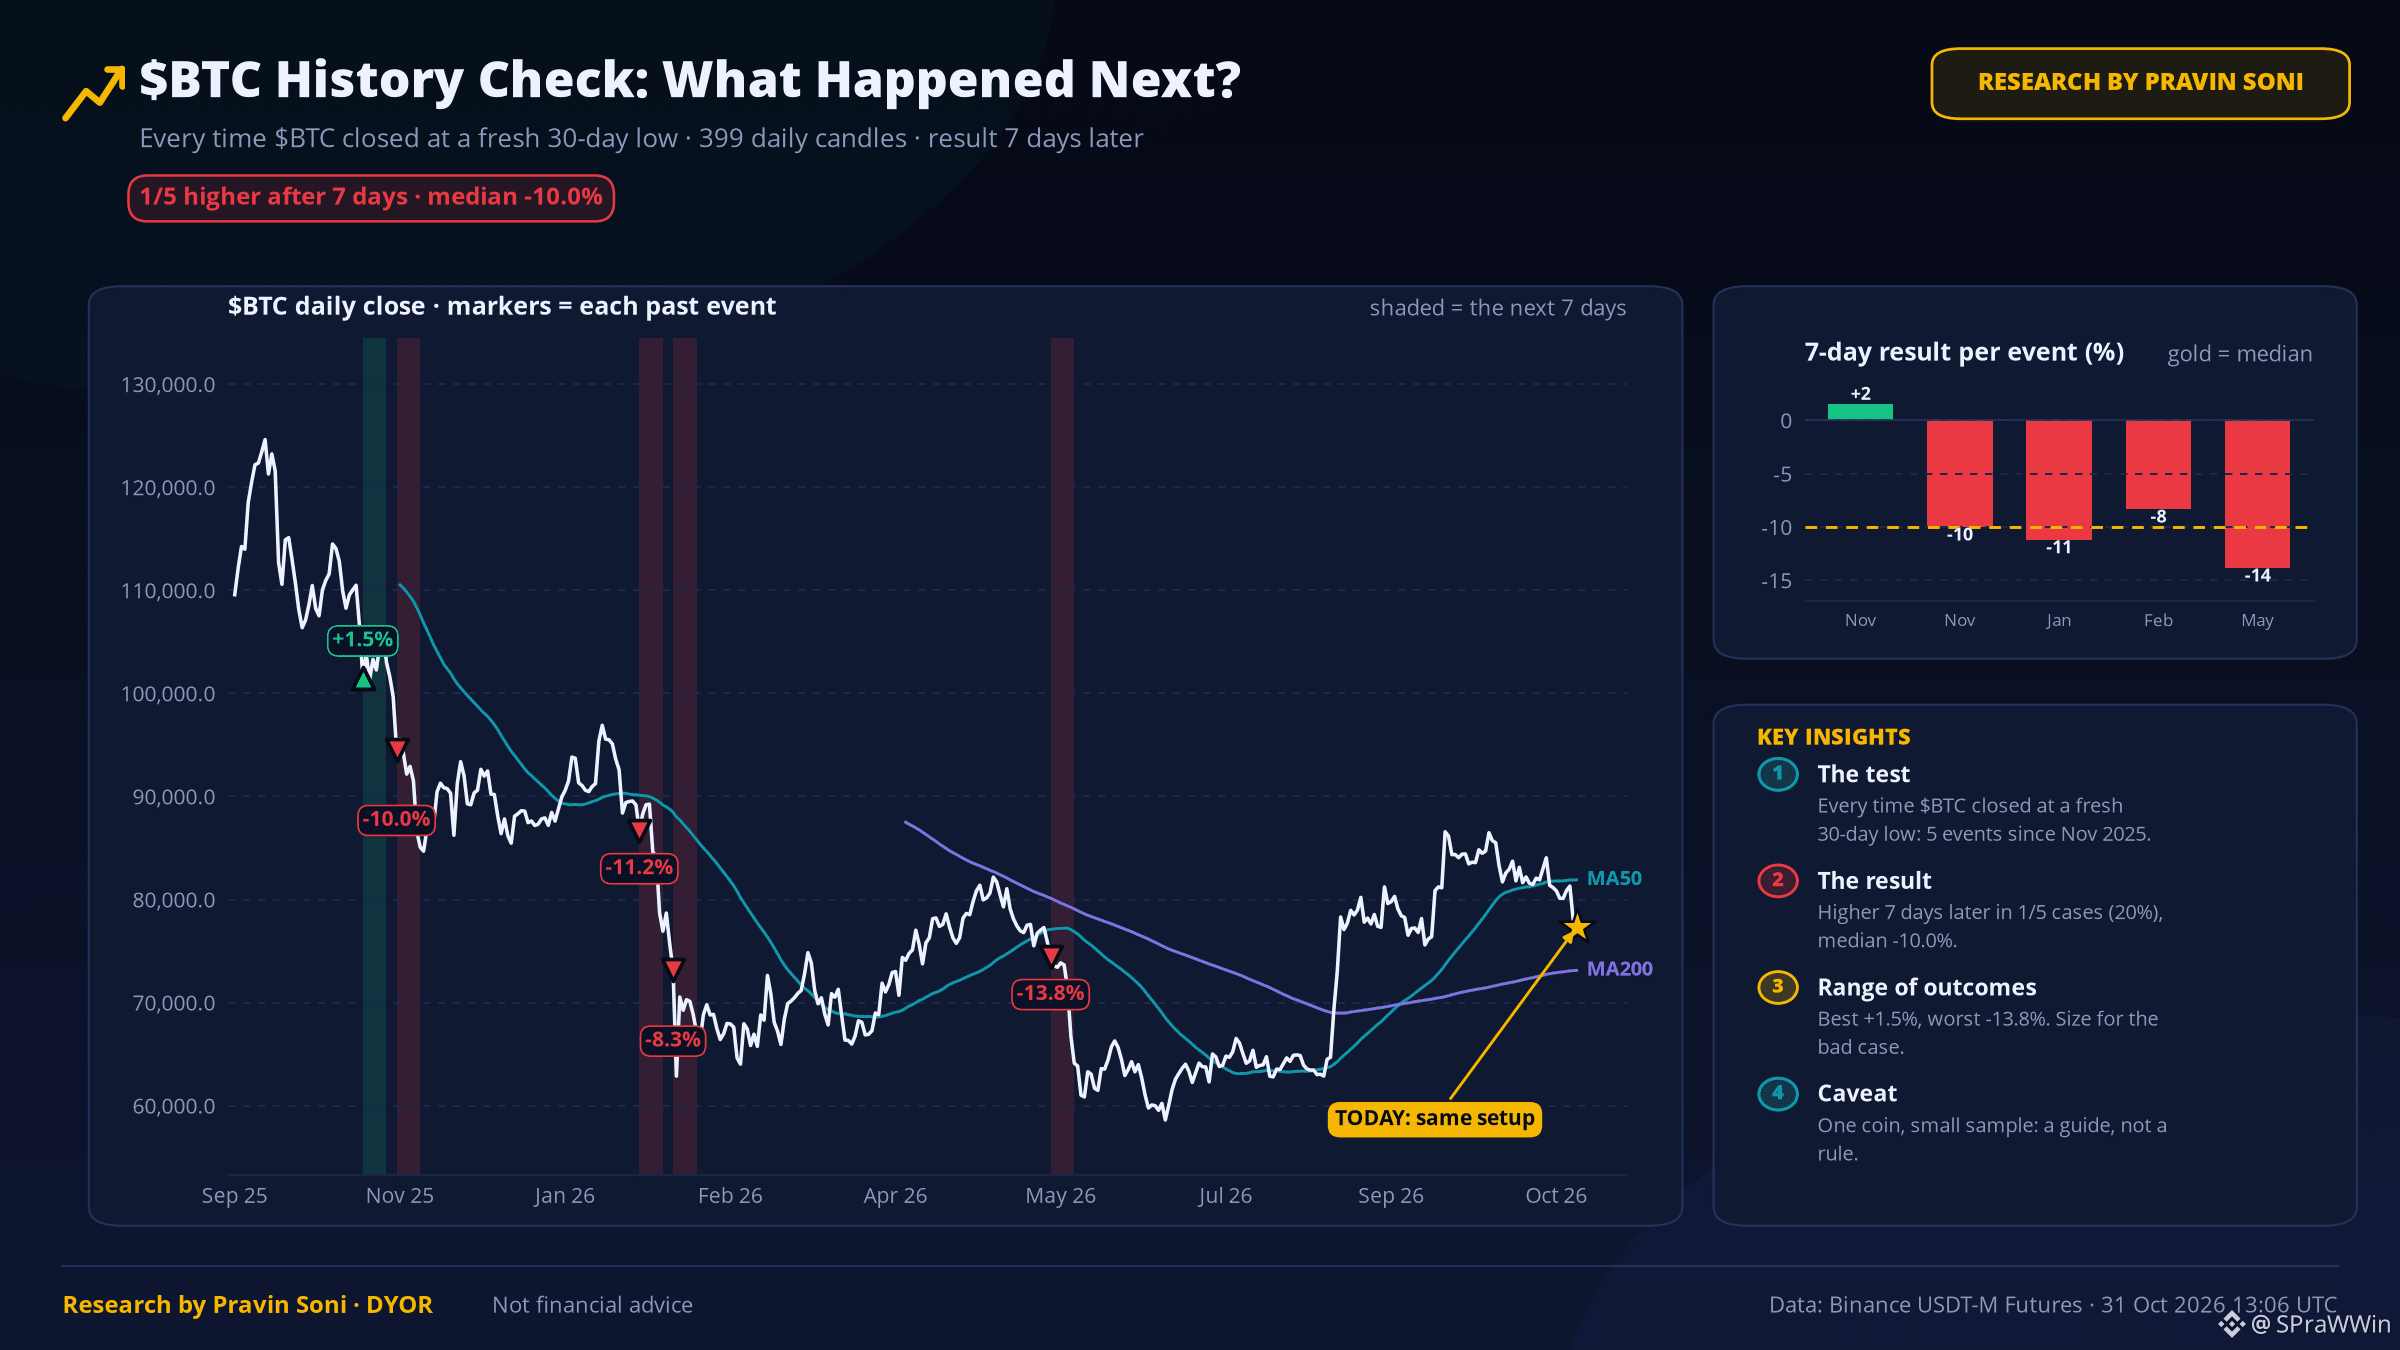
The last 5 times $BTC closed at a fresh 30-day low, it was higher 7 days later in 1 of 5 cases (median -10.0%). Small sample, so a guide, not a rule.
🗺️ 7-day range map
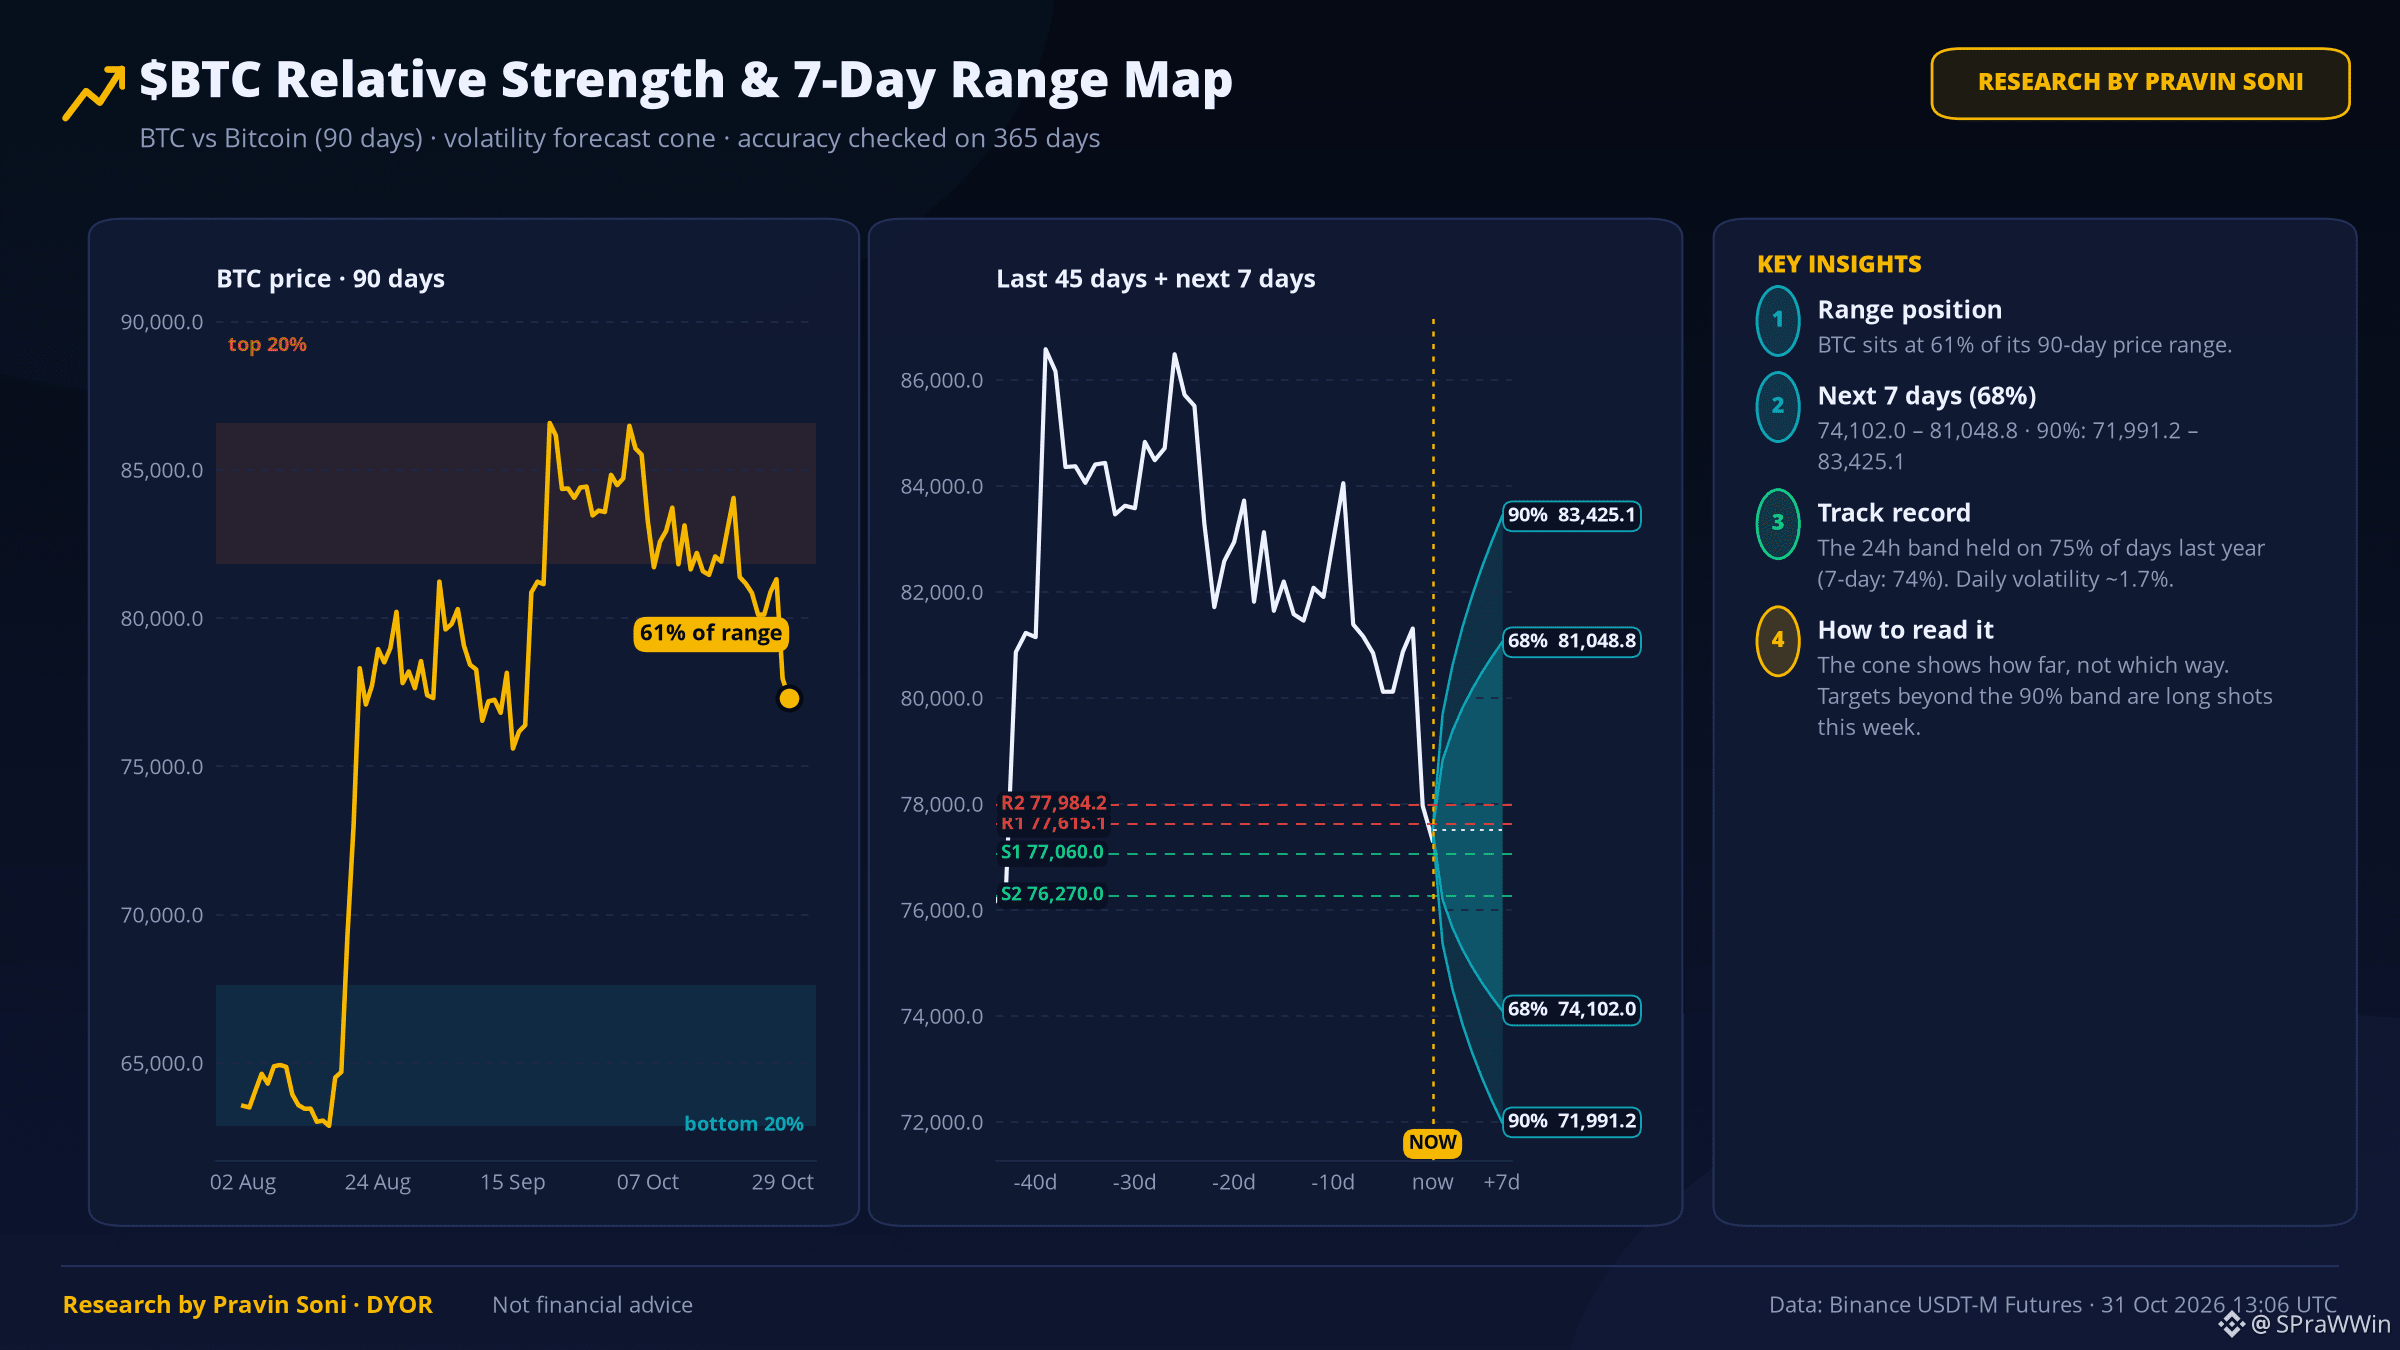
68% band: 74,102.0 – 81,048.8 · 90% band: 71,991.2 – 83,425.1
This band held on 75% of days last year. It shows how far, not which way.
🎯 Levels that matter
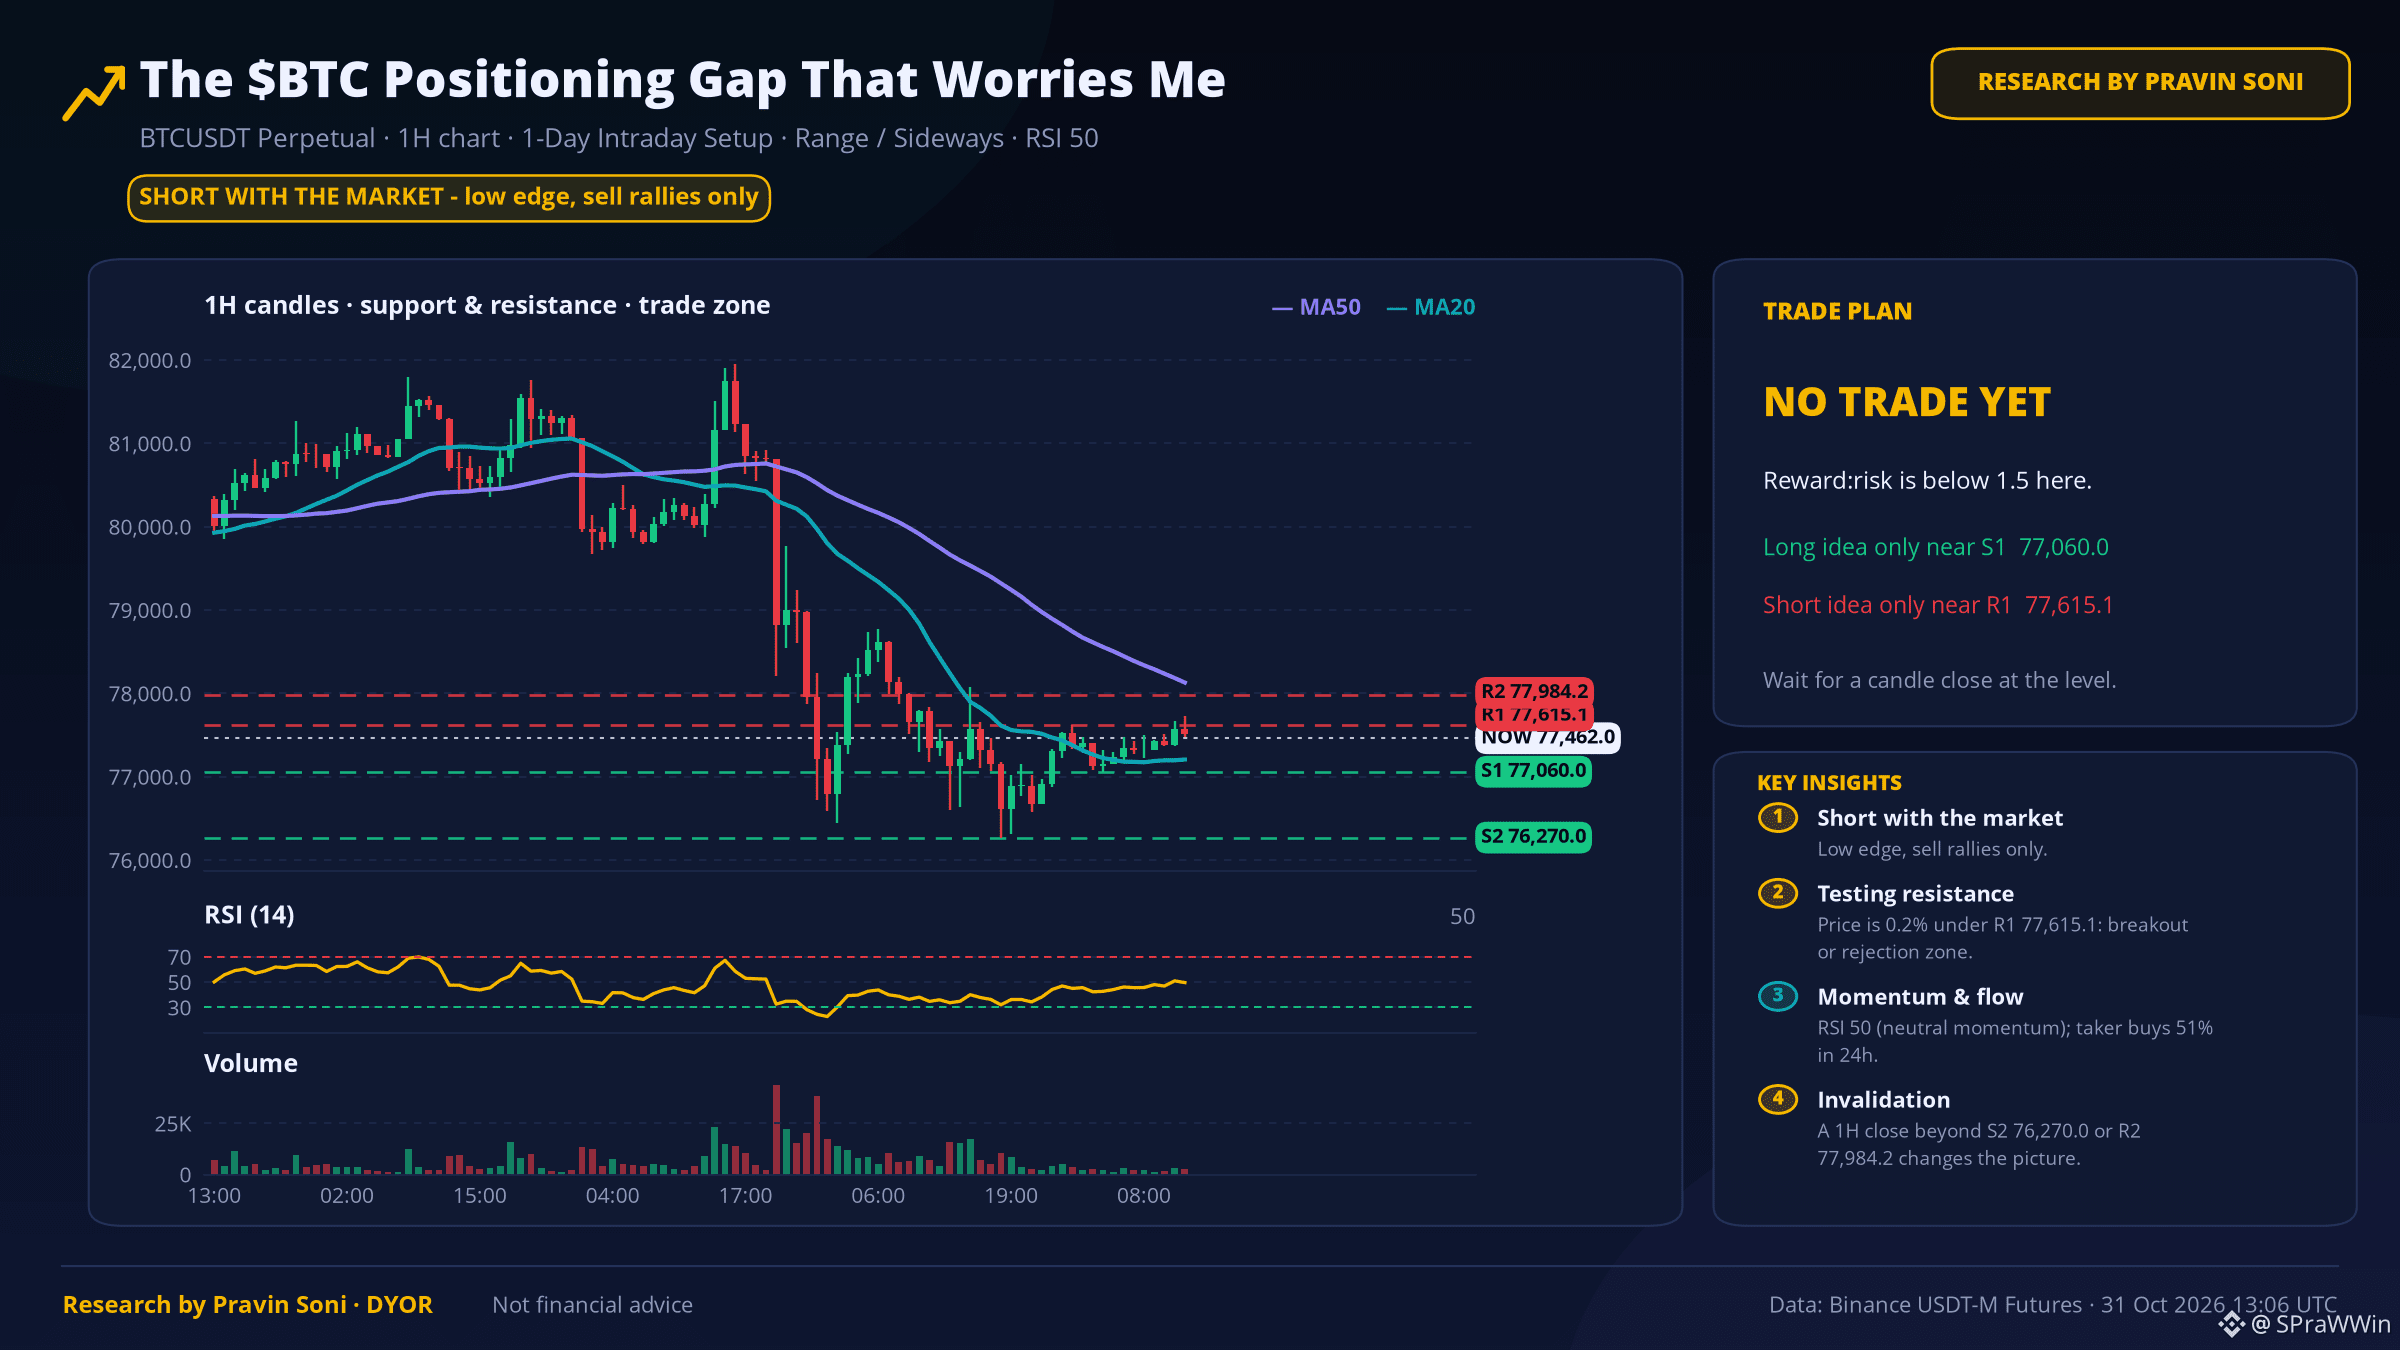
🟢 Bull case: daily close above 77,615.1 → 77,984.2
🔴 Bear case: daily close below 77,060.0 → 76,270.0
🧠 My read: Pressure is to the downside while 77,615.1 caps it. A break of 77,060.0 opens the next leg.
📰 Cointelegraph, 3h ago: 🇺🇸 The US $BTC ETFs saw their largest single day outflows since June with over $643M flowing out in a single day. News | Markets | YouTube
💬 What's your read here: bullish, bearish or waiting?
Not financial advice · Data: Binance Futures
$BTC #BTC #Whales #CryptoAnalysis
⚠️ Research by Pravin Soni - DYOR
TL;DR: Top traders more bearish than the crowd; 73% of accounts are long. History leans down (1/5). Price 77,497.6, daily RSI 34.
🔍 What the numbers show
1️⃣ Top traders' position ratio is 1.72 vs their account ratio 2.80 — big money is leaning short.
2️⃣ 73% of Binance accounts are long (L/S 2.64) — the crowd is one-sided, a contrarian warning.
⏪ Has this happened before?
The last 5 times $BTC closed at a fresh 30-day low, it was higher 7 days later in 1 of 5 cases (median -10.0%). Small sample, so a guide, not a rule.
🗺️ 7-day range map
68% band: 74,102.0 – 81,048.8 · 90% band: 71,991.2 – 83,425.1
This band held on 75% of days last year. It shows how far, not which way.
🎯 Levels that matter
🟢 Bull case: daily close above 77,615.1 → 77,984.2
🔴 Bear case: daily close below 77,060.0 → 76,270.0
🧠 My read: Pressure is to the downside while 77,615.1 caps it. A break of 77,060.0 opens the next leg.
📰 Cointelegraph, 3h ago: 🇺🇸 The US $BTC ETFs saw their largest single day outflows since June with over $643M flowing out in a single day. News | Markets | YouTube
💬 What's your read here: bullish, bearish or waiting?
Not financial advice · Data: Binance Futures
$BTC #BTC #Whales #CryptoAnalysis
⚠️ Research by Pravin Soni - DYOR