$SOL $BTC $ETH
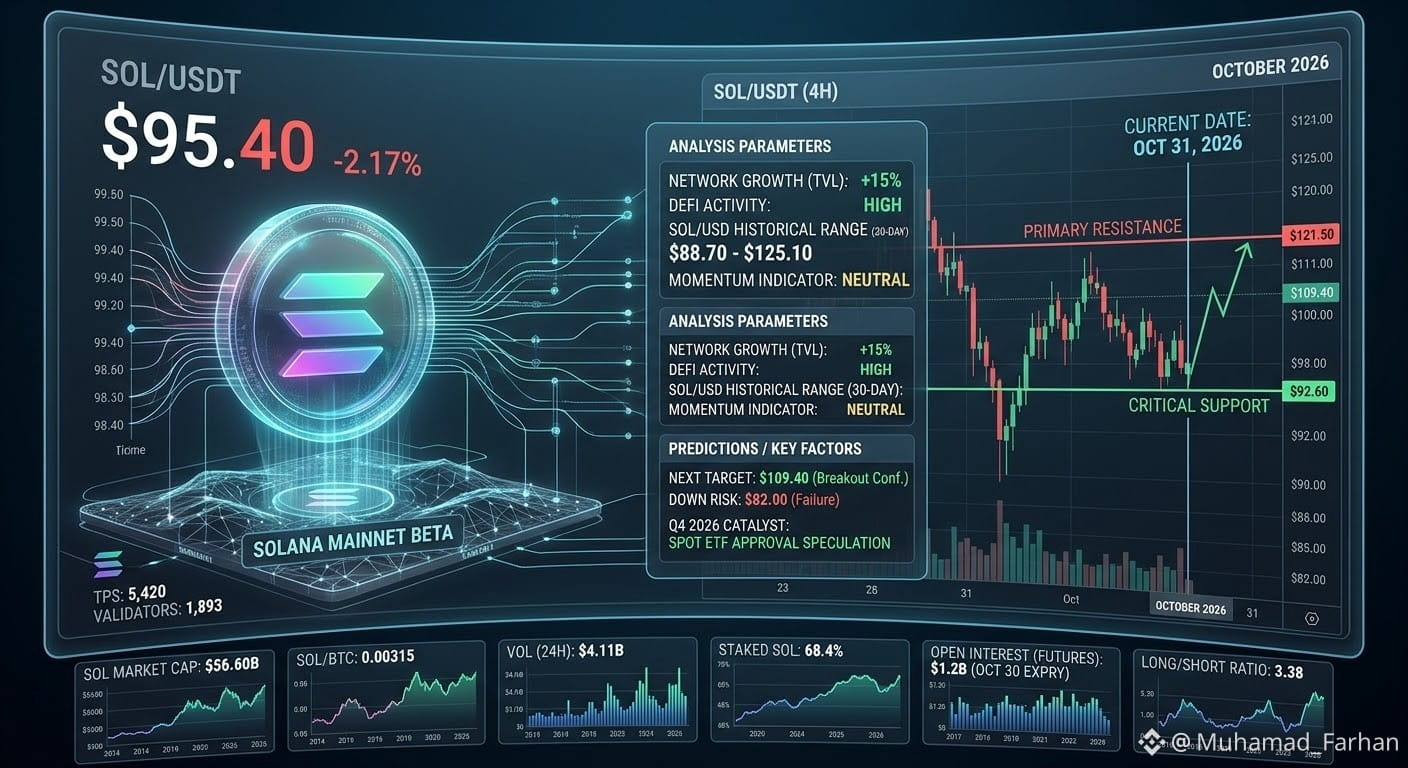
Here is the latest technical breakdown and visual chart layout for SOL/USDT.
📊 SOL/USDT SOL/USDT - 4H / Daily Sep '26 Oct Indicators: - 14-Day RSI: ~34 (Approaching Oversold Territory) - Long/Short Ratio: 3.38 (Bullish Bias in Futures, High Liquidation Risk)
🔍 Technical Analysis Summary
Current Trend & Price Action:
Price Point: SOL is currently retesting the $93.00 – $95.50 range after scaling down from October highs near $121.50.
The chart shows a short-term bearish pullback within a broader consolidation corridor, putting pressure on key psychological levels around $90.00 – $92.60.
Key Support Levels:
Immediate Support ($92.60): Critical hold level for short-term bulls. A breakdown below this opens room for dynamic selling.
Primary Demand Zone ($88.70 - $90.00): Aligns with the 200-day Simple Moving Average (SMA), which serves as a heavy structural base.
Macro Floor ($82.00 - $84.60): Major monthly closing support if volatility spikes further down.
Key Resistance Levels:
First Obstacle ($105.00 - $109.40): The confluence of the 50-day EMA and local breakdown pivot. Retaking $109 confirms trend recovery.
Major Target ($121.50 - $125.00): Range high resistance; breaking above this shifts the mid-term chart structure firmly bullish.
Futures & Volume Insight:
Futures data indicates high long-side positioning (Long/Short ratio ~3.38), meaning a hold above $92.60 could spark a quick relief bounce toward $105, while a breakdown below $88 could trigger long liquidations.
#ASICHasReceivedNoPredictionMarketApplications #Binance #ETH #BTC #ASICHasReceivedNoPredictionMarketApplications
Here is the latest technical breakdown and visual chart layout for SOL/USDT.
📊 SOL/USDT SOL/USDT - 4H / Daily Sep '26 Oct Indicators: - 14-Day RSI: ~34 (Approaching Oversold Territory) - Long/Short Ratio: 3.38 (Bullish Bias in Futures, High Liquidation Risk)
🔍 Technical Analysis Summary
Current Trend & Price Action:
Price Point: SOL is currently retesting the $93.00 – $95.50 range after scaling down from October highs near $121.50.
The chart shows a short-term bearish pullback within a broader consolidation corridor, putting pressure on key psychological levels around $90.00 – $92.60.
Key Support Levels:
Immediate Support ($92.60): Critical hold level for short-term bulls. A breakdown below this opens room for dynamic selling.
Primary Demand Zone ($88.70 - $90.00): Aligns with the 200-day Simple Moving Average (SMA), which serves as a heavy structural base.
Macro Floor ($82.00 - $84.60): Major monthly closing support if volatility spikes further down.
Key Resistance Levels:
First Obstacle ($105.00 - $109.40): The confluence of the 50-day EMA and local breakdown pivot. Retaking $109 confirms trend recovery.
Major Target ($121.50 - $125.00): Range high resistance; breaking above this shifts the mid-term chart structure firmly bullish.
Futures & Volume Insight:
Futures data indicates high long-side positioning (Long/Short ratio ~3.38), meaning a hold above $92.60 could spark a quick relief bounce toward $105, while a breakdown below $88 could trigger long liquidations.
#ASICHasReceivedNoPredictionMarketApplications #Binance #ETH #BTC #ASICHasReceivedNoPredictionMarketApplications