$WLFI: Calm Chart, Racing Mind
Imagine a hypothetical researcher who checks the chart once, feels calm, then refreshes every few minutes until the mind races. The watchlist is quiet; the internal dialogue is not. This is a common trap: seeing a fast move in $WLFI and immediately rewriting the plan.
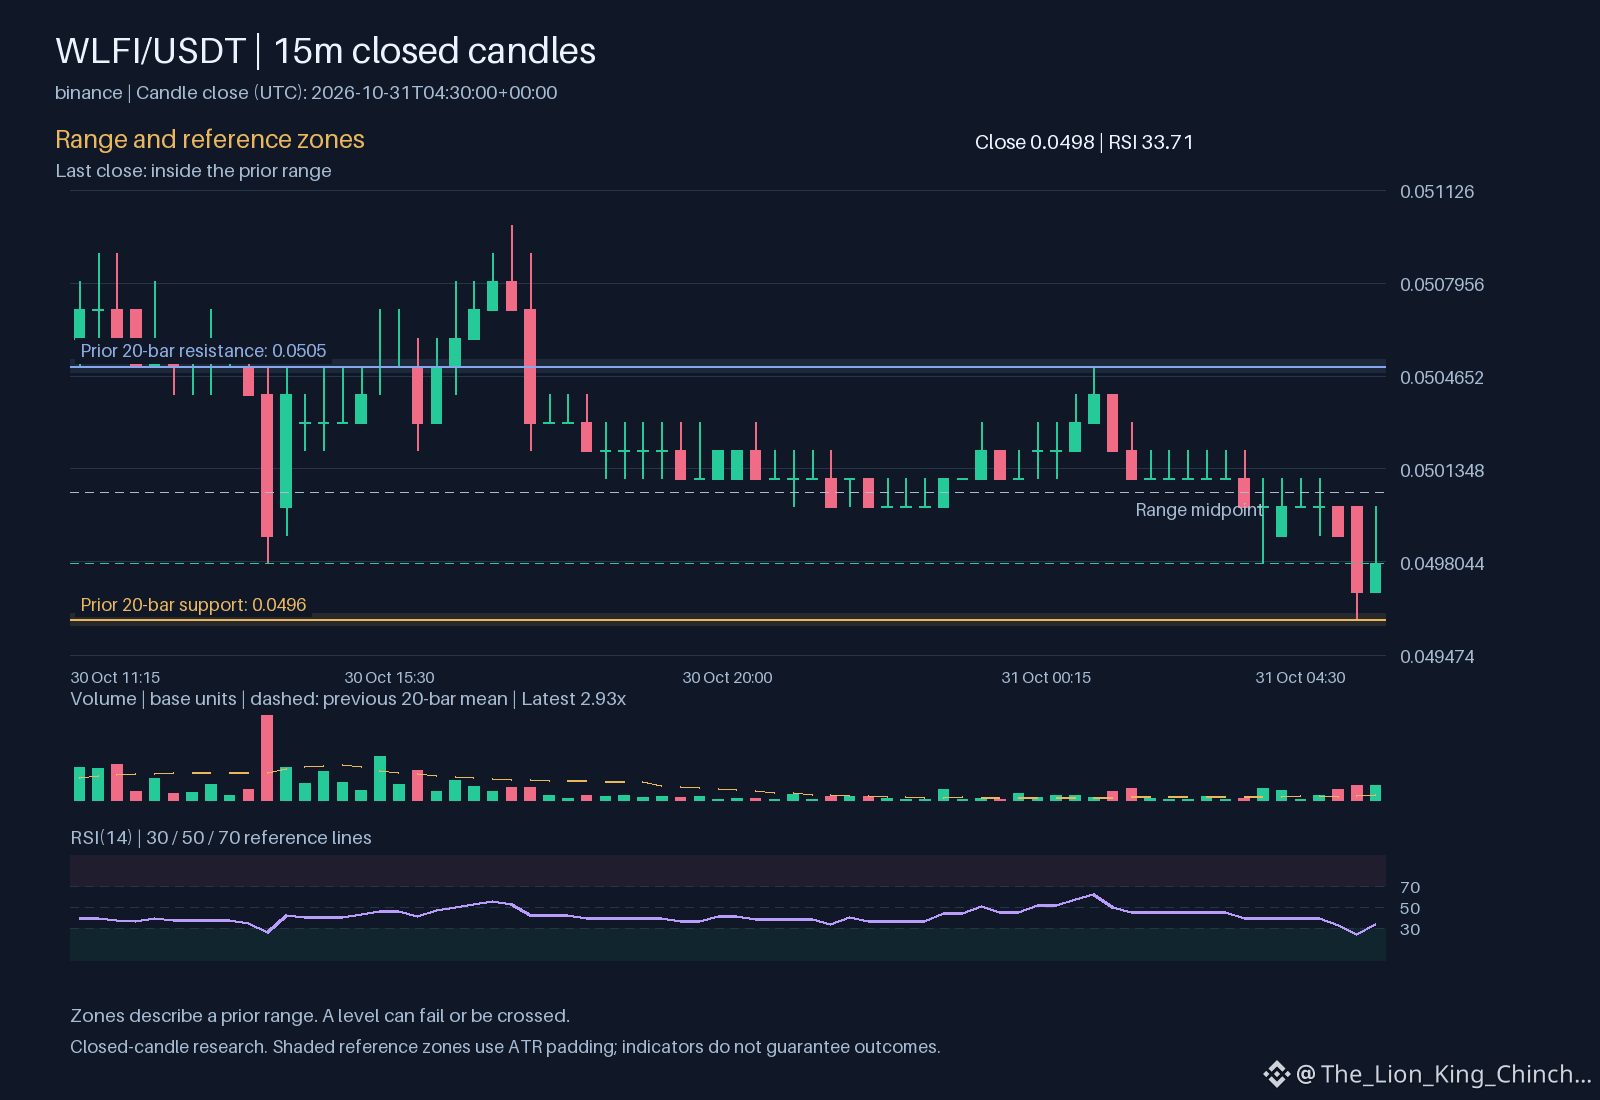
The chart shows a down direction on the hourly timeframe. Relative volume is above baseline, meaning activity is elevated compared to the recent norm. The current price is 0.0498. The twenty hourly average is 0.0500126. These facts are static. The confusion comes from interpreting them in real time. When volume expands during a drop, it might signal conviction from sellers, or it might just be a cluster of stop losses triggering. Without context, both stories fit the data perfectly. The brain prefers a single, immediate explanation, but the market rarely offers one at the moment of the move. This is where the habit of premature rule changing kicks in. You see the price testing the support level at 0.0496 and think, "This is breaking." Or you see a small bounce toward 0.0505 and think, "This is reversing." Both thoughts are guesses dressed as analysis.
A useful habit is to separate observation from interpretation. Record what is true: price is down, volume is high, RSI is at 33.7136. Then wait. The lesson is not to ignore volume. It is to delay the narrative. When data changes quickly, the interpretation should move slower than the price. If you catch yourself altering a rule after a fast tick, pause. Ask if the rule was sound before the move started. If yes, let it run. The chart does not know your anxiety. It only records trades. Let the next few hourly candles confirm or deny the initial read before you commit to a story. This reduces the noise in your head and keeps the research honest.
Probabilistic market research, not a recommendation or guaranteed return.
Have you caught yourself changing a rule after seeing a fast move?
#WLFI