$HYPE: Relative Volume and Market Presence
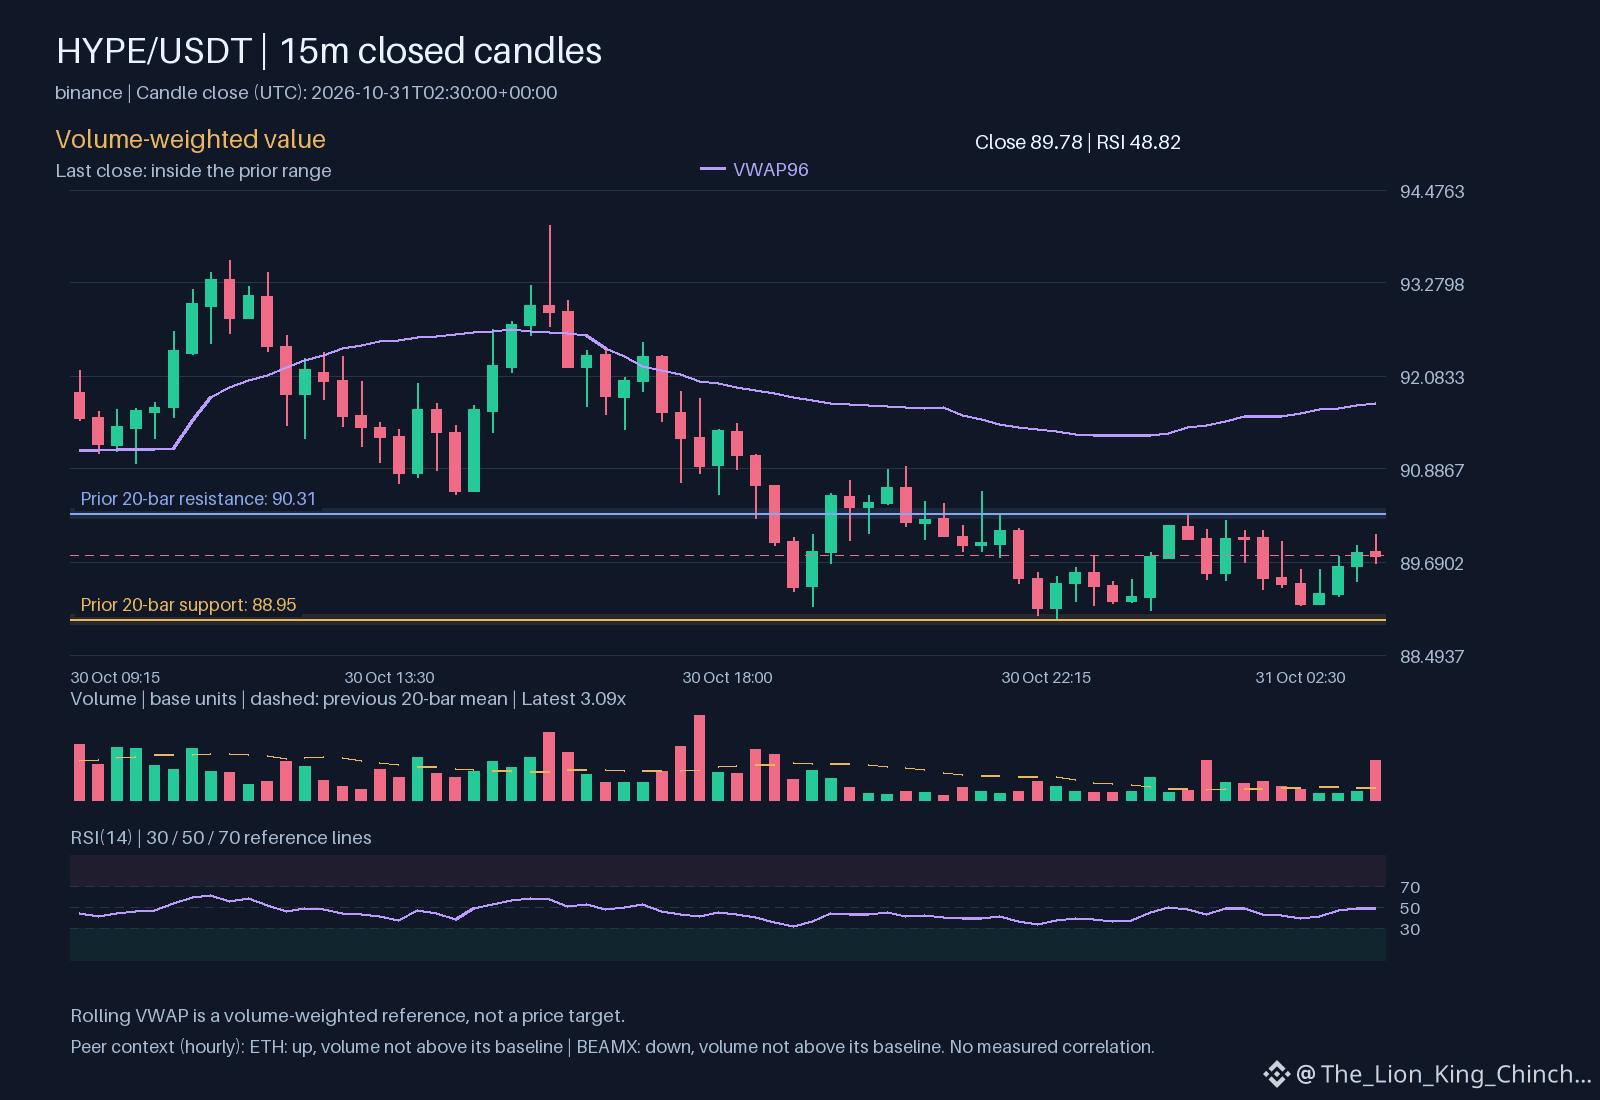
Understanding $HYPE requires a close look at how activity interacts with price. Currently, $HYPE is trading inside its recorded range with an hourly direction that is up. The most notable observation is that volume is above its baseline. This suggests a higher level of participation than usual for this specific asset on its primary venue. To evaluate if this is unique, we look at peers trading on the same exchange during this same hour. While $HYPE shows rising activity, ETH has an hourly direction up with volume not above its baseline. Meanwhile, BEAMX shows an hourly direction down, also without increased volume. These differences illustrate that even when assets share a venue, their immediate interest levels vary. It is important to remember that seeing these assets move in the same or opposite direction during a single hour does not establish a measured correlation or a common cause. High relative volume is a mechanism where increased trade frequency can impact the stability of a trend. If the $HYPE price continues to climb while volume remains high, it suggests the move has active support. However, if volume fades while price remains near resistance 90.31, the move might lack the necessary conviction to break out. To reassess this interpretation, observe whether the RSI 48.8206 stays within neutral bounds or if the change 0.695379 begins to revert toward the vwap 91.7275. The way a move holds often reveals more about its durability than its initial direction 📈.
Probabilistic market research, not a recommendation or guaranteed return.
The comparison to keep in mind: $ETH has hourly direction up and volume not above its baseline; $BEAMX has hourly direction down and volume not above its baseline. This alone does not establish correlation.
Which matters more in this comparison: direction or how the move holds?
#HYPE #ETH #BEAMX #CryptoWatchlist #CryptoLearning
Binance spot proof for $HYPE: closed price 89.78 USDT.
Source: binance. Closed candle: 2026-10-31T02:30:00+00:00.