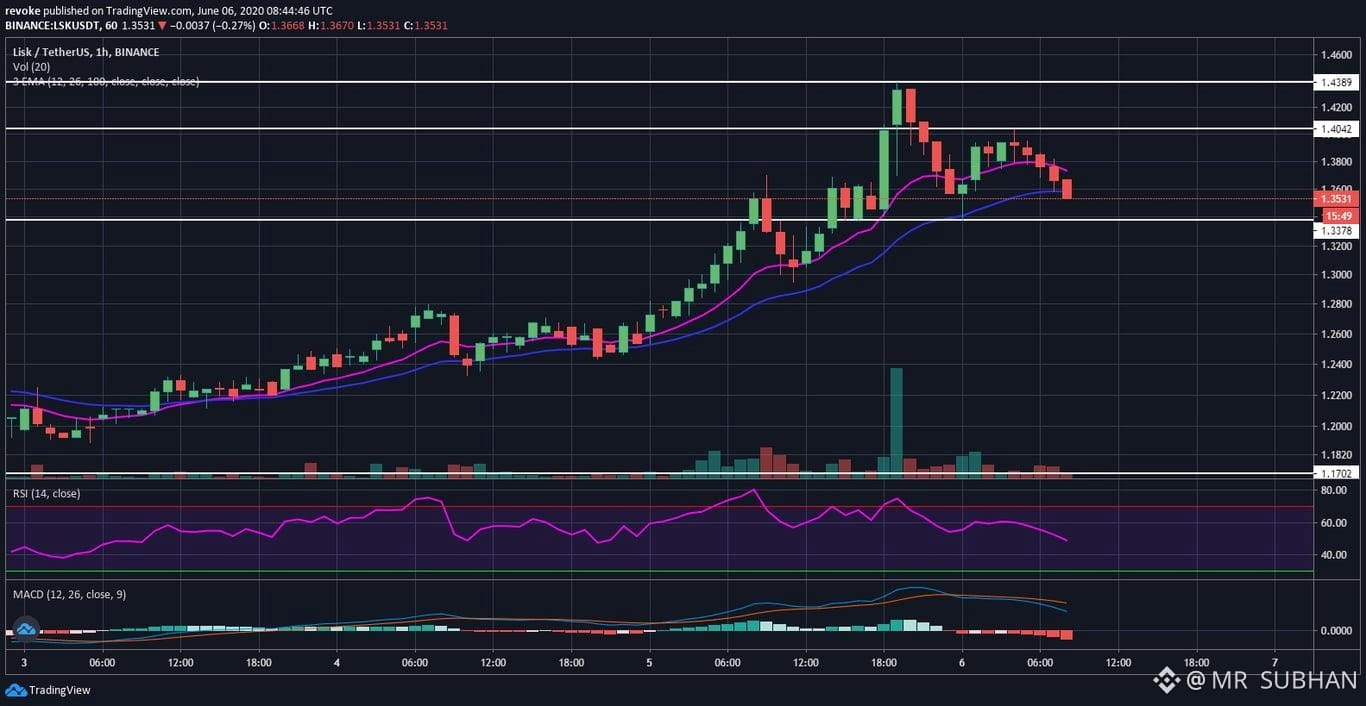
$LSK WILL go to UP ???
#UniswapA16zSeekDeFiExemptionFromIllinoisCryptoTax #USMidtermElections
Recent daily candle structure
Date Open High Low
Oct 28 $0.1642 $0.2149 $0.1635
Oct 27 $0.1669 $0.1709 $0.1639
Oct 26 $0.1586 $0.1728 $0.1564
Oct 25 $0.1636 $0.1646 $0.1568
Source: LBank historical price data.
Important candle observation: The October 28 candle is a very large bullish candle, closing near its high after a substantial price expansion. This suggests strong buying pressure, but the large range also signals elevated volatility.
If LSK closes above $0.2172 on the 4-hour or daily chart with strong volume:
Target 1: $0.2379
Target 2: $0.2530
Target 3: $0.2880
A successful retest of $0.2172 as support would strengthen the bullish setup.
🔴 Bearish scenario
If LSK loses the $0.1804 support:
Target 1: $0.1622
Target 2: $0.1420
A daily close below $0.1622 would make the recovery structure significantly weaker.
5. Technical indicator analysis
Indicator Latest reading Interpretation
RSI (4H) 63.5 Bullish momentum
RSI (1D) 49.6 Neutral
RSI (1W) 51.1 Neutral
Moving averages Mostly bullish Recovery trend
Bullish engulfing: A strong green candle covers the previous red candle's body, potentially indicating buying pressure.
Hammer: A long lower wick near support can signal rejection of lower prices.
Bearish engulfing: A large red candle covering the previous green candle can signal a potential reversal.
Doji: Indicates indecision; wait for the next candle to confirm direction.
#UniswapA16zSeekDeFiExemptionFromIllinoisCryptoTax #USMidtermElections
Recent daily candle structure
Date Open High Low
Oct 28 $0.1642 $0.2149 $0.1635
Oct 27 $0.1669 $0.1709 $0.1639
Oct 26 $0.1586 $0.1728 $0.1564
Oct 25 $0.1636 $0.1646 $0.1568
Source: LBank historical price data.
Important candle observation: The October 28 candle is a very large bullish candle, closing near its high after a substantial price expansion. This suggests strong buying pressure, but the large range also signals elevated volatility.
If LSK closes above $0.2172 on the 4-hour or daily chart with strong volume:
Target 1: $0.2379
Target 2: $0.2530
Target 3: $0.2880
A successful retest of $0.2172 as support would strengthen the bullish setup.
🔴 Bearish scenario
If LSK loses the $0.1804 support:
Target 1: $0.1622
Target 2: $0.1420
A daily close below $0.1622 would make the recovery structure significantly weaker.
5. Technical indicator analysis
Indicator Latest reading Interpretation
RSI (4H) 63.5 Bullish momentum
RSI (1D) 49.6 Neutral
RSI (1W) 51.1 Neutral
Moving averages Mostly bullish Recovery trend
Bullish engulfing: A strong green candle covers the previous red candle's body, potentially indicating buying pressure.
Hammer: A long lower wick near support can signal rejection of lower prices.
Bearish engulfing: A large red candle covering the previous green candle can signal a potential reversal.
Doji: Indicates indecision; wait for the next candle to confirm direction.