🐕🔥 SHIBA INU (SHIB) — BULLISH MOMENTUM IS BUILDING! 🚀
Is SHIB preparing for its next move? 👀
Let's take a closer look at the latest SHIB/USDT chart!
📊 MARKET OVERVIEW
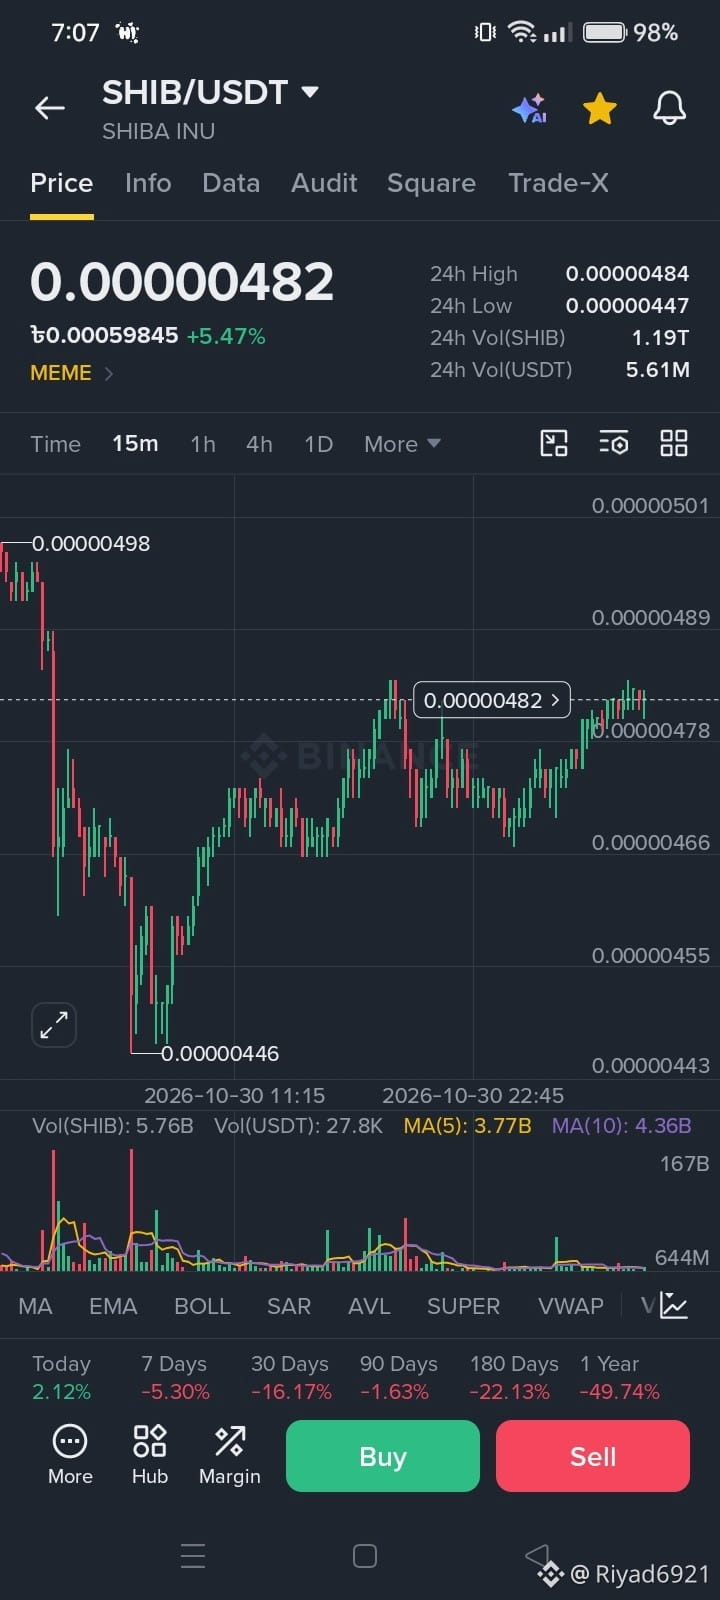
💰 Current Price: 0.00000482 USDT
🟢 24H Change: +5.47%
📈 24H High: 0.00000484 USDT
📉 24H Low: 0.00000447 USDT
🔍 TECHNICAL ANALYSIS
🟢 1. Recovery Momentum
SHIB has recovered from its recent low around 0.00000446 and is showing positive short-term momentum.
🟡 2. Resistance Zone
The 0.00000484–0.00000489 area is an important resistance zone to watch. A strong breakout with increased buying volume could support further upside.
🟢 3. Support Levels
The 0.00000478 and 0.00000466 areas are potential short-term support zones. Holding above these levels could help maintain the current recovery structure.
📊 4. Volume Analysis
Trading volume is something to watch closely. Stronger buying volume during a breakout would provide better confirmation of bullish momentum.
💡 MY MARKET VIEW
SHIB is showing encouraging short-term recovery signs on the 15-minute chart. However, the price is approaching resistance, so confirmation is important before expecting another upward move.
Remember: Patience, research, and risk management are essential in crypto trading.
🚀 LET'S DISCUSS!
Can SHIB break above 0.00000484 and continue its recovery?
Or will sellers defend the resistance zone?
👇 Share your thoughts and analysis!
#SHIB #ShibaInu #SHIBUSDT #BinanceSquare #CryptoAnalysis #MemeCoins #CryptoCommunity #TechnicalAnalysis #DYOR $SHIB