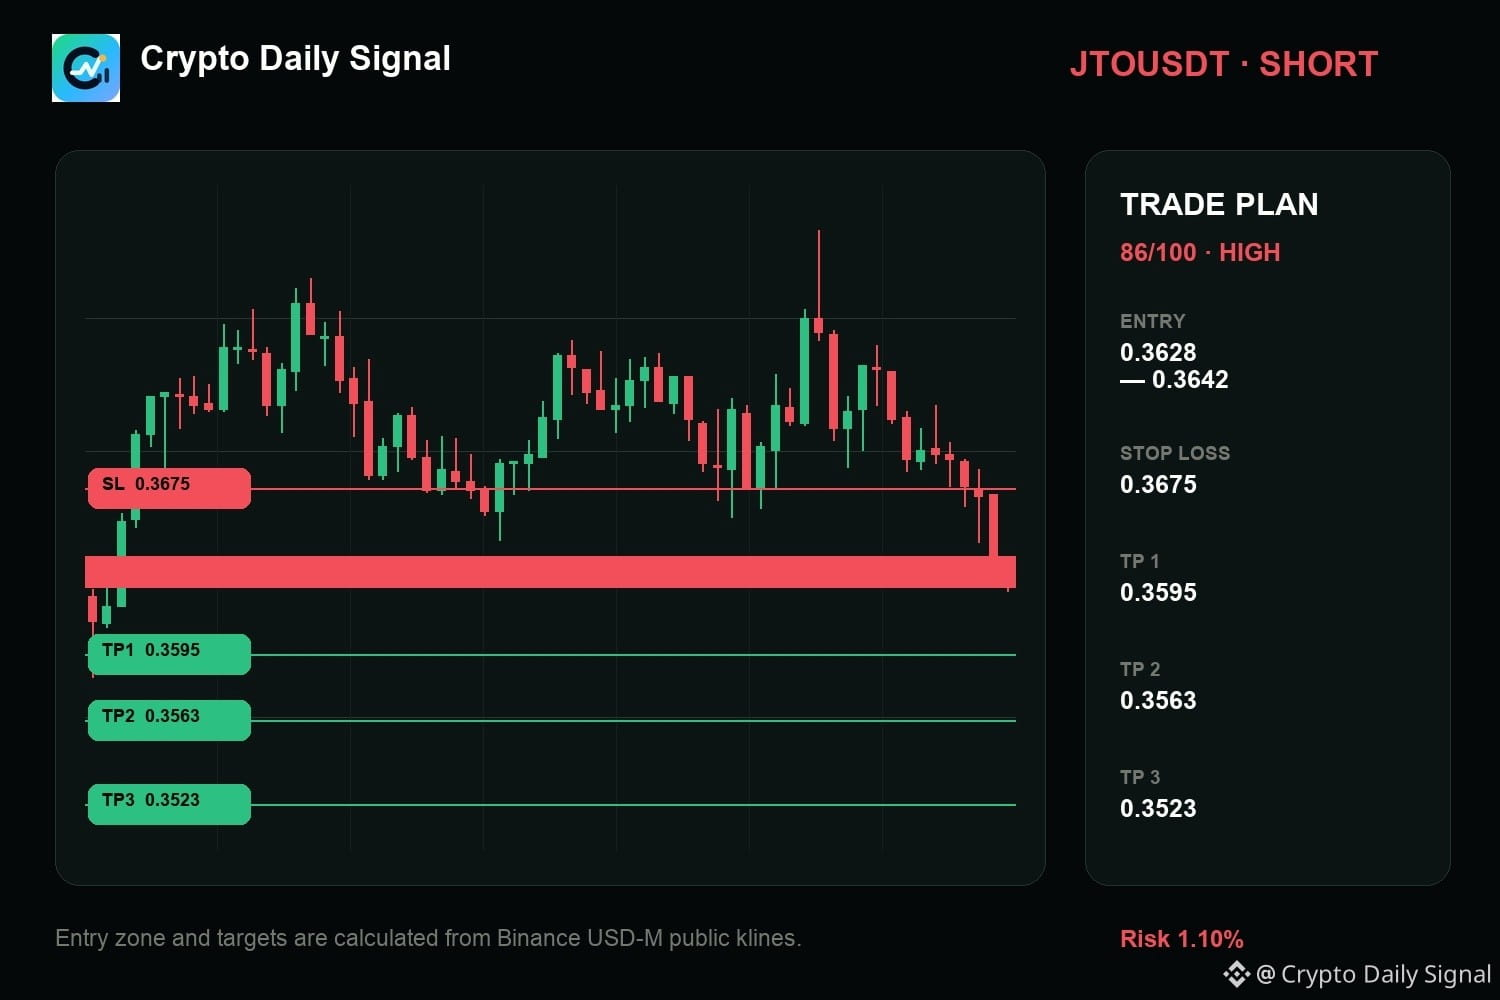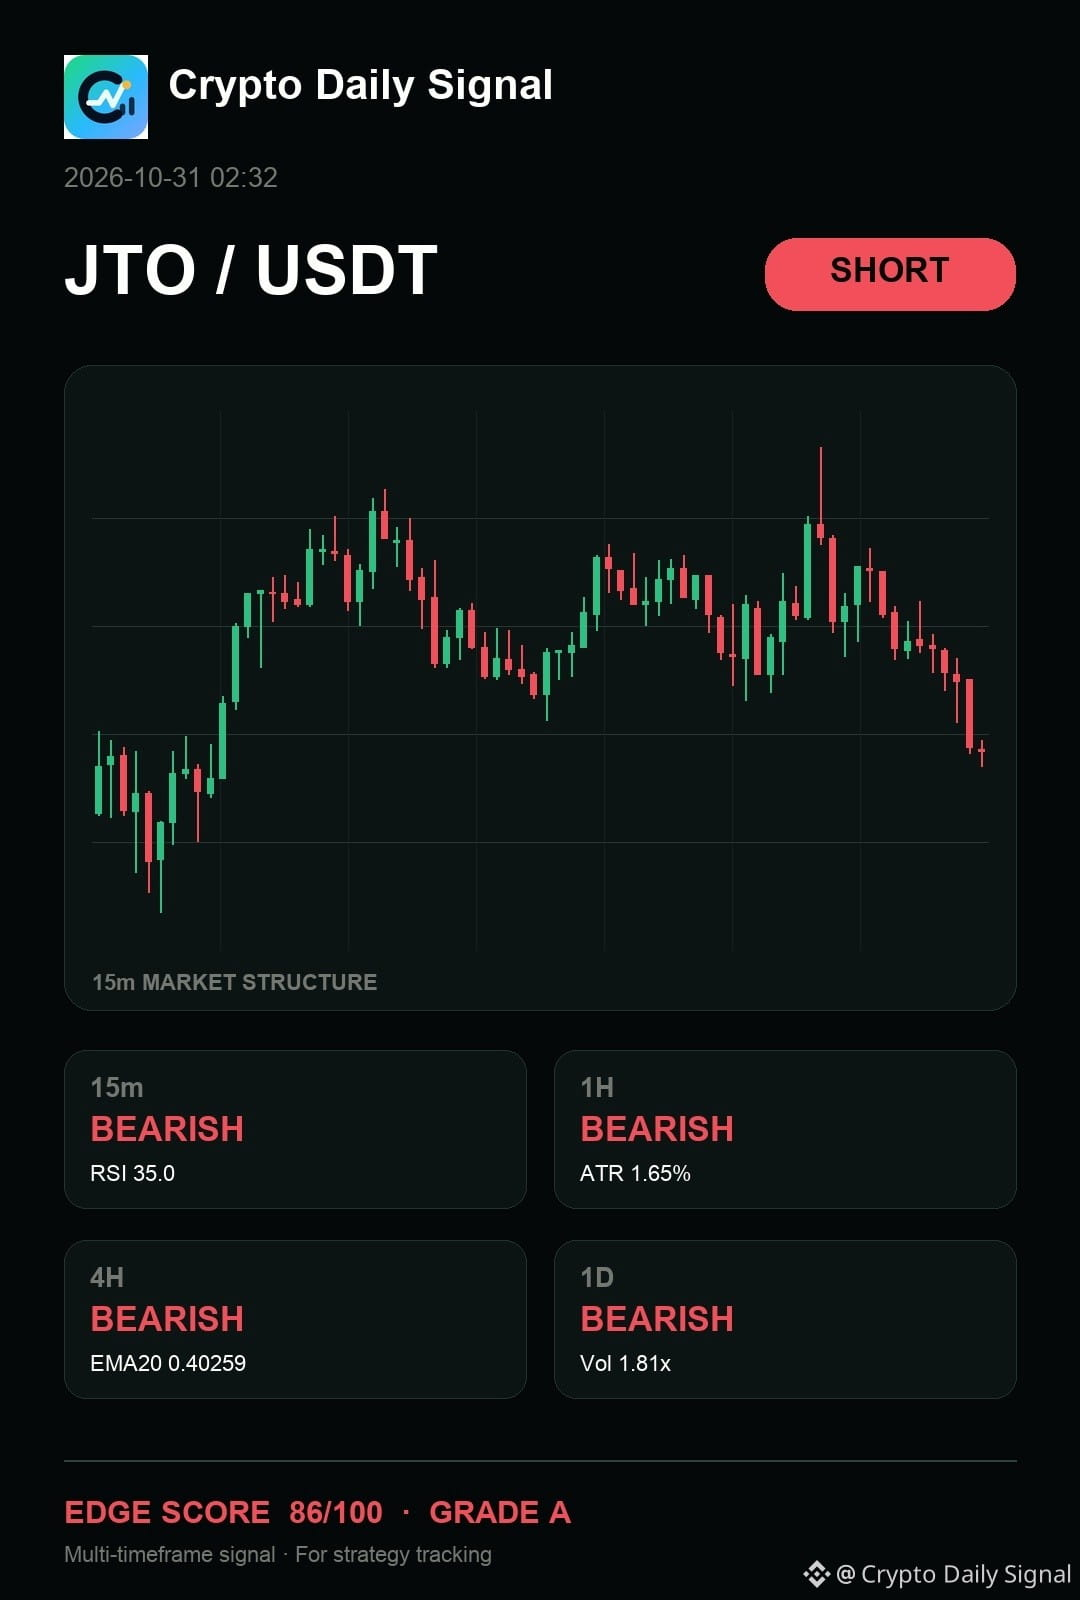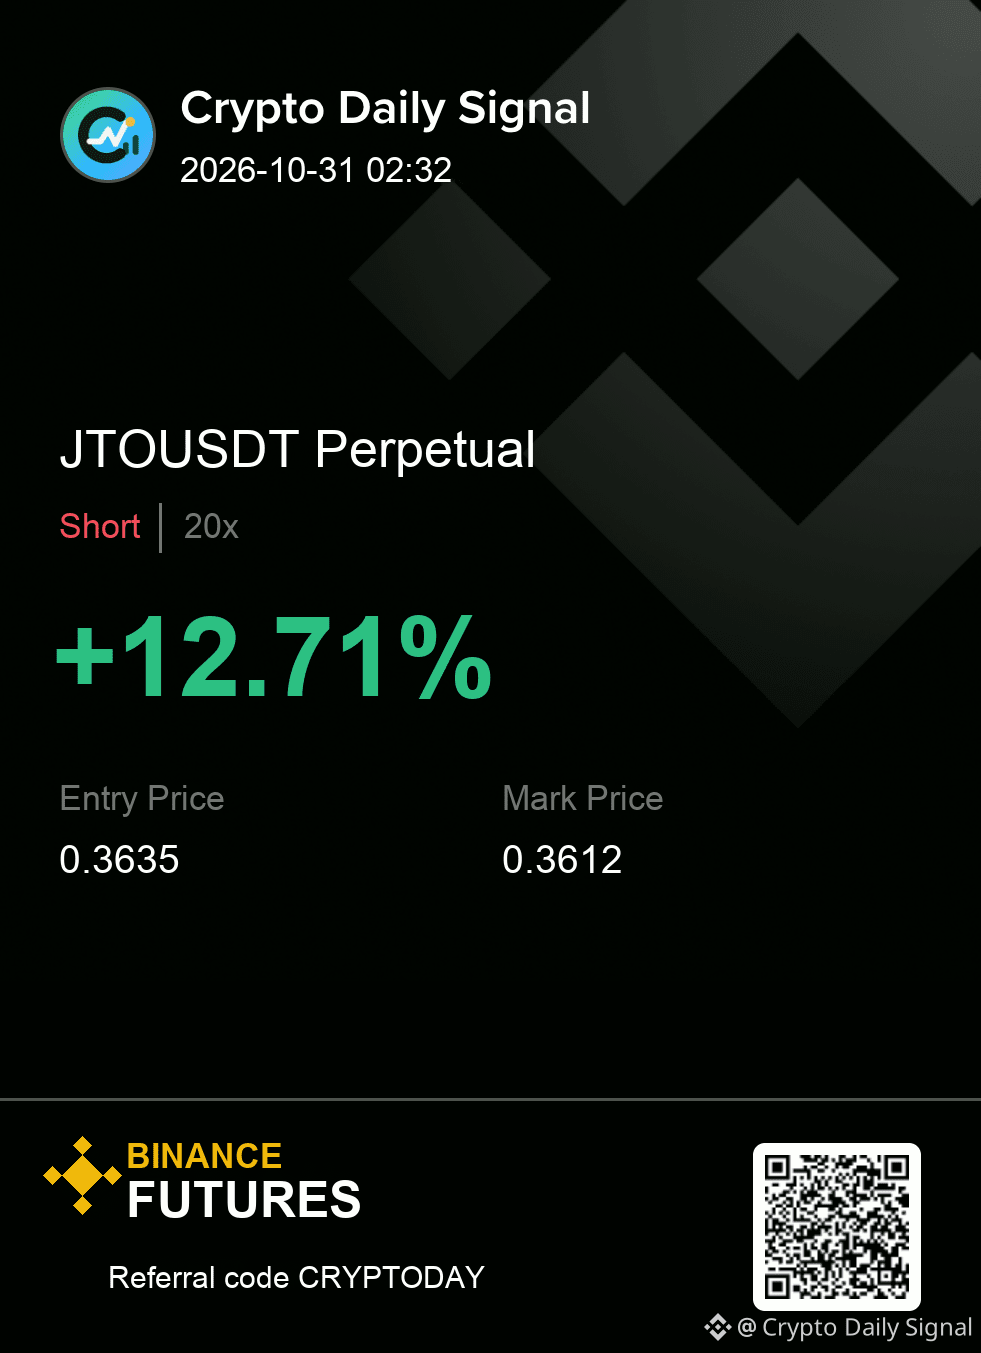
$JTO — honestly, the chart still says it is still tilted toward sellers even though the immediate trading action is boxed in tight. The lower timeframes are all painting a bearish picture, which lines up with the longer-term direction. A breach below the current support level would make the short more convincing. If it breaks firmly above the top of this range, that’s a signal to reconsider the downside thesis.
No chase outside the zone; the stop defines the whole idea.
Levels — JTOUSDT
Zone: 0.3628 - 0.3642
Cut: 0.3675
Scale: 0.3595 | 0.3563 | 0.3523
#Futures
No chase outside the zone; the stop defines the whole idea.
Levels — JTOUSDT
Zone: 0.3628 - 0.3642
Cut: 0.3675
Scale: 0.3595 | 0.3563 | 0.3523
#Futures