
Tesla (TSLA) Stock Analysis: Strong Selling Pressure — Can TSLA Recover?
📊 Market Overview
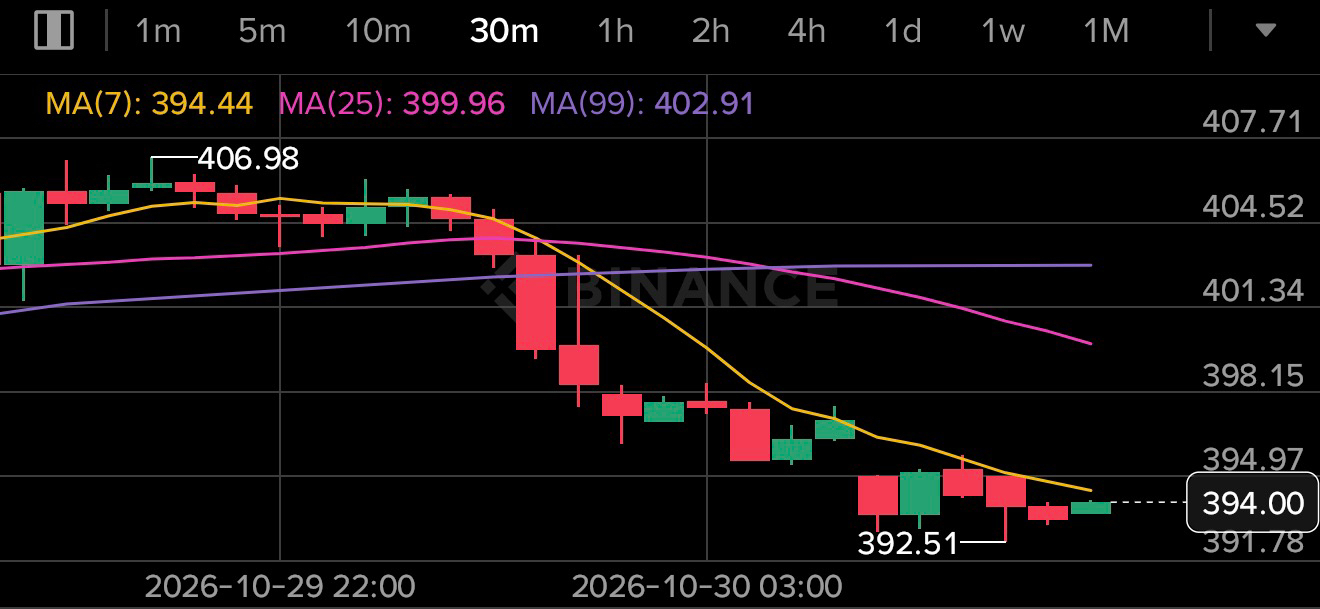
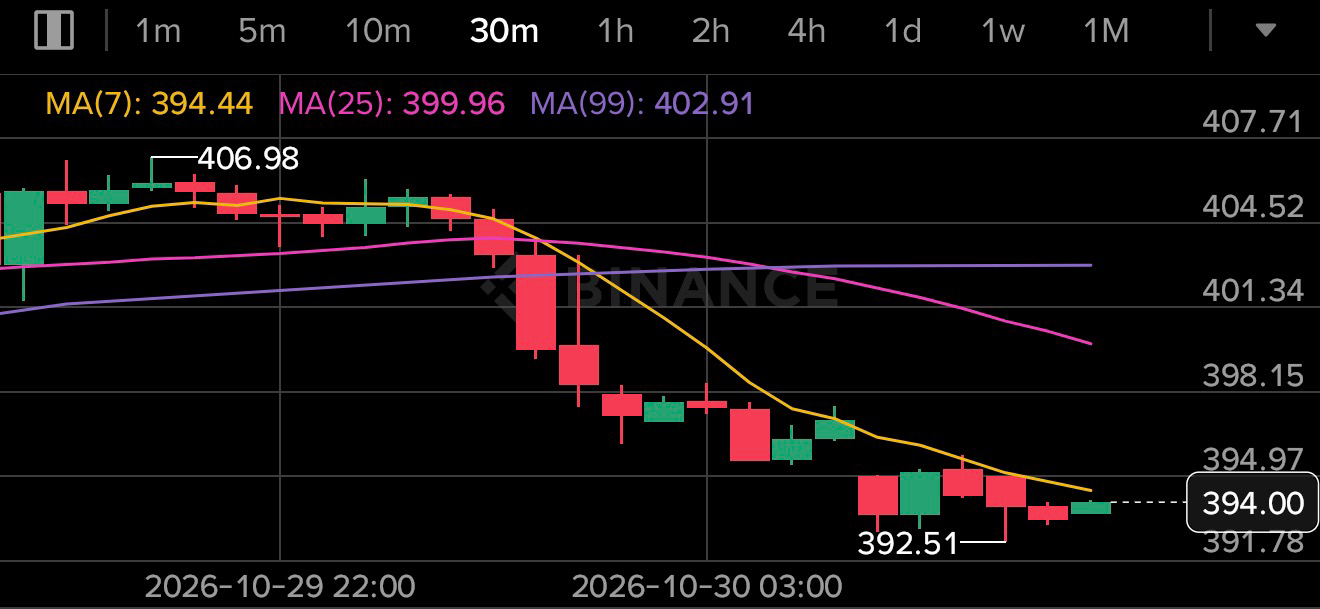
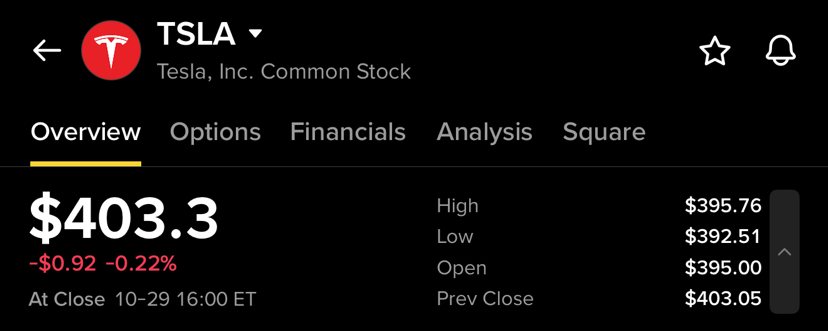
Tesla (TSLA) is showing significant selling pressure in the chart provided. The displayed price is around $403.30, and several consecutive red candles indicate that sellers have been dominating the short-term price action.
The chart shows a sharp downward move followed by a small attempt at recovery. However, the latest green candles alone are not enough to confirm a trend reversal. Traders should watch the next few candles carefully to understand whether buyers are returning or sellers remain in control.
🔍 Technical Analysis
1. Short-Term Trend
The short-term trend appears bearish. The price is trading below the moving-average lines shown on the chart, while the yellow moving average is pointing downward. This suggests that downward momentum remains strong.
2. Support Levels
The recent low near the bottom of the chart is an important area to monitor. If the price holds above this area and buying volume increases, TSLA could attempt a short-term rebound.
However, if the recent low breaks, further downside may be possible. Traders should wait for price confirmation rather than assuming support will hold.
3. Resistance Levels
The first resistance area is near the recent consolidation zone around $405–$410. A stronger recovery would require the price to move above nearby resistance and sustain that move.
Higher moving-average lines may also act as resistance if the price attempts a larger recovery.
These price zones are approximate interpretations of the supplied screenshot, not confirmed live market levels.
📈 What Could Happen Next?
Bullish Scenario 🟢
If buyers step in, TSLA could recover from its recent lows and test nearby resistance. Increasing volume and consecutive strong green candles would provide better evidence of a potential rebound.
Bearish Scenario 🔴
If selling pressure continues and the recent low breaks, the stock could experience another downward move. Weak recovery attempts may allow sellers to remain in control.
💡 What Should Traders Watch?
* Price action around the recent low.
* Whether green candles show stronger buying volume.
* A possible breakout above nearby resistance.
* Moving-average direction and overall market sentiment.
* Confirmation before making any trading decision.
🧠 Final Thoughts
Tesla is currently showing a bearish short-term structure in the provided chart. Although a recovery is possible, buyers need to demonstrate stronger momentum before a bullish reversal can be confirmed.
Patience and risk management are important in volatile markets. Avoid making decisions based on a single candle, and remember that stock prices can change quickly.
💬 Join the Discussion
What do you think about Tesla’s next move?
🟢 Will TSLA recover from these levels?
🔴 Or will selling pressure continue?
Share your analysis and thoughts in the comments!
#Tesla #stockmarket #TechnicalAnalysis #trading #BinanceSquare $TSLA