$BNB ANALYSIS: Is $BNB Preparing for a Recovery or Another Drop?
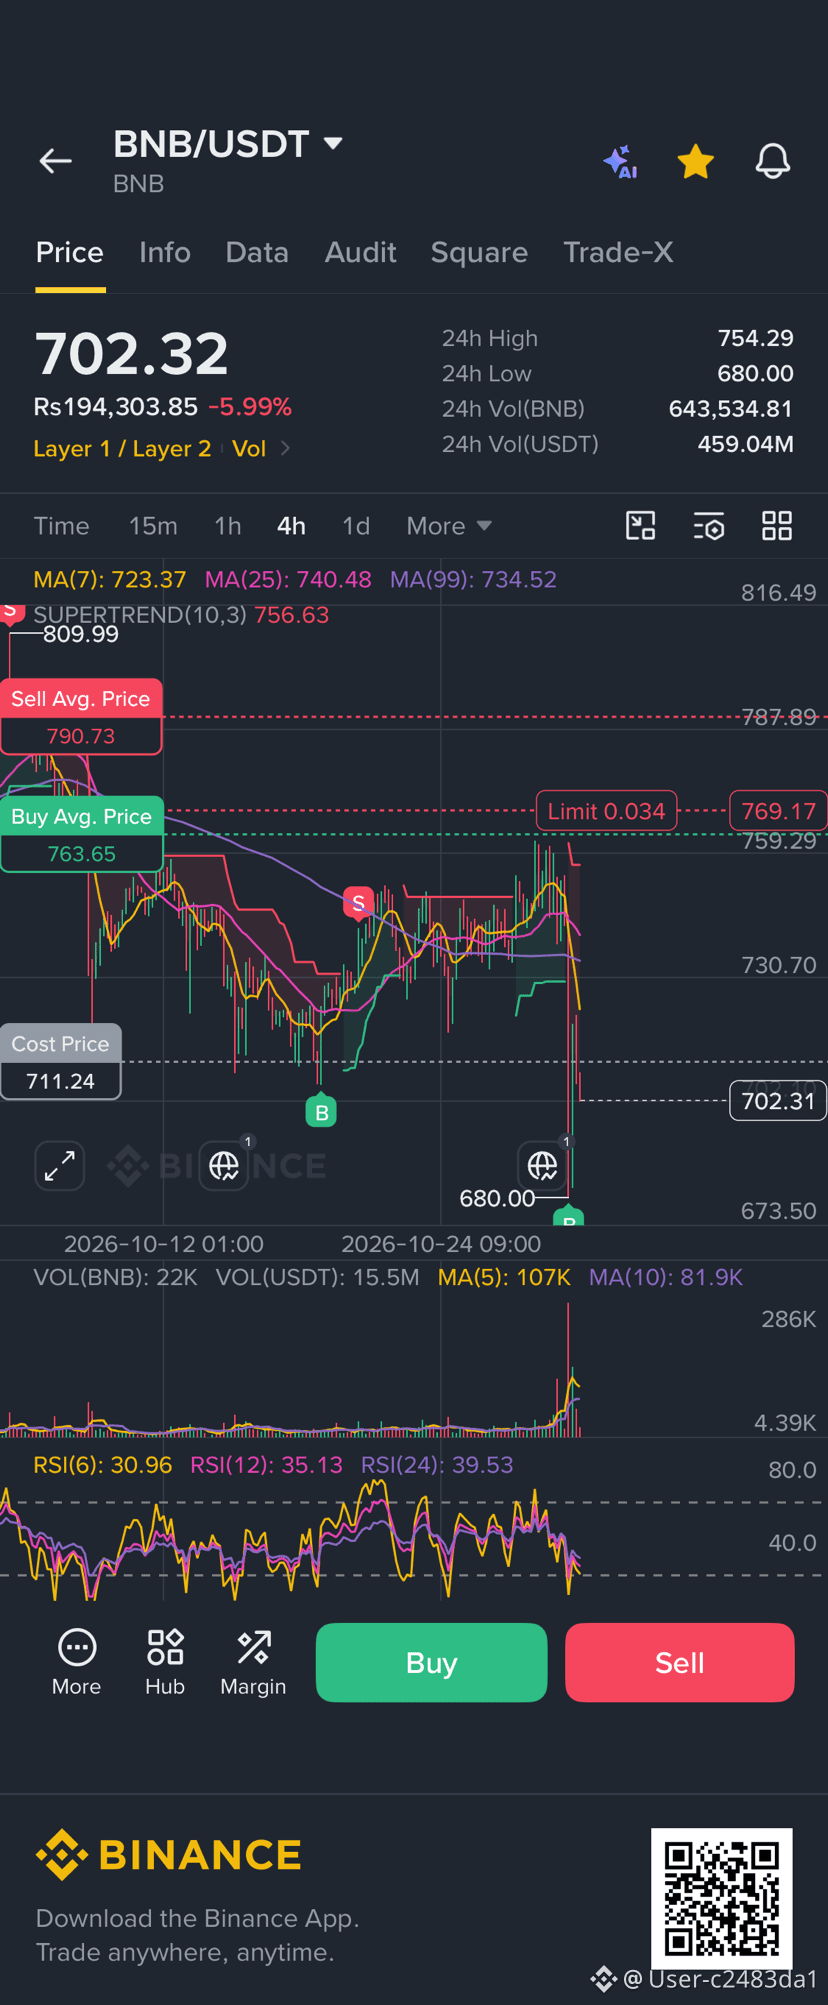
$BNB is showing significant bearish pressure on the 4H timeframe, trading around $702 in the chart snapshot after a sharp decline of approximately 6%.
🔴 Bearish Signals:
Price is trading below MA(7), MA(25), and MA(99).
Supertrend remains bearish around $756.
Strong selling volume confirms increased downside pressure.
RSI indicators are approaching oversold territory.
🟢 Key Support Zones:
$700 — Psychological support.
$680 — Critical recent low.
🎯 Resistance Levels:
$723 — First recovery target.
$734–740 — Important resistance zone.
$754–756 — Major trend reversal area to watch.
My Market Outlook:
#BNB is currently under bearish pressure, but RSI readings suggest that a short-term relief bounce is possible.
If buyers defend the $680 zone and price successfully reclaims $723, we could see a recovery towards $740.
However, a decisive breakdown below $680 could expose BNB to further downside.
⚠️ My Strategy: I would avoid chasing a trade during this volatility. I would wait for confirmation through price action and volume before considering a new position.
Remember: A bounce is not necessarily a trend reversal.
What do you think? Will BNB recover towards $740, or will bears push it below $680?
#BNB #BNBUSDT #Binance #CryptoAnalysis #TechnicalAnalysis #CryptoTrading #Altcoins👀🚀