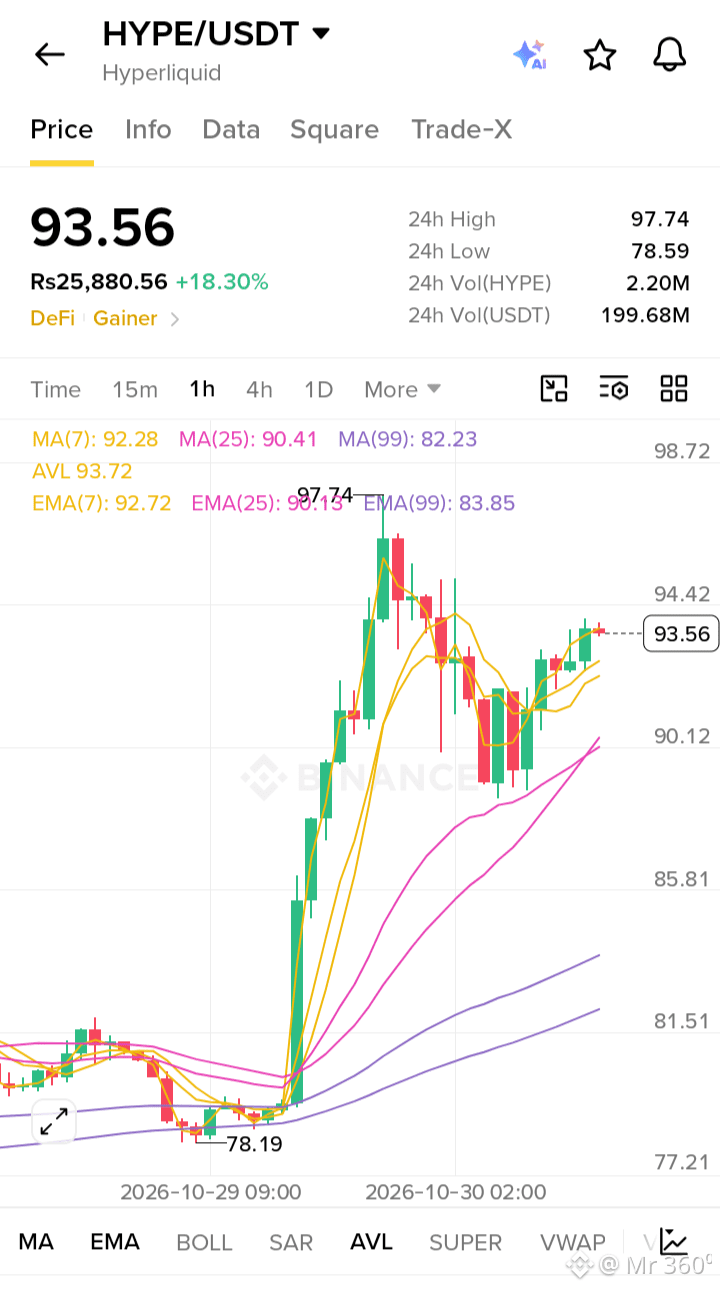
$HYPE /USDT (Hyperliquid)
Price Action & Performance
HYPE is currently trading at $93.56, reflecting a substantial gain of +18.30% over the session. The asset experienced a strong bullish impulse, surging from a 24-hour low of $78.59 to a peak of $97.74 before entering a consolidation phase. The price action remains firmly in an uptrend, though it is currently pulling back slightly from the local high.
Technical Levels
Resistance: The immediate resistance is the recent 24-hour high at $97.74. A successful breach of this level would signal continued price discovery.
Support: The primary support zone lies between the EMA7 ($92.72) and MA7 ($92.28). Deeper structural support is found at the MA25 level of $90.41.
Indicators & Volume
The 1-hour chart shows the moving averages (MA7, EMA7, MA25) all trending sharply upward, confirming the strong bullish momentum. The price is currently holding above these short-term averages. Trading volume is robust, with 24-hour turnover reaching 199.68M USDT, indicating strong market participation. The current consolidation appears to be a healthy pause following the aggressive breakout from the $78 support base.
Market Scenarios
Bullish Scenario: If the price holds above the $92-$93 support cluster and successfully breaks the $97.74 resistance, the asset could target psychological levels toward $100.
Bearish Scenario: A loss of the immediate EMA7/MA7 support could lead to a deeper retracement toward the MA25 at $90.41. A breakdown below this level would neutralize the short-term bullish structure.
Disclaimer: This analysis is for informational purposes only and does not constitute financial advice. Trading cryptocurrencies involves significant risk.
$HYPE
#TwoAddressesHoldingAbout1.28BUSDTFrozen #BinanceWillListPredictPREDICT #USMidtermElections #EarningsSeason