$BTC
#BTC AI analysis
Trend Analysis:
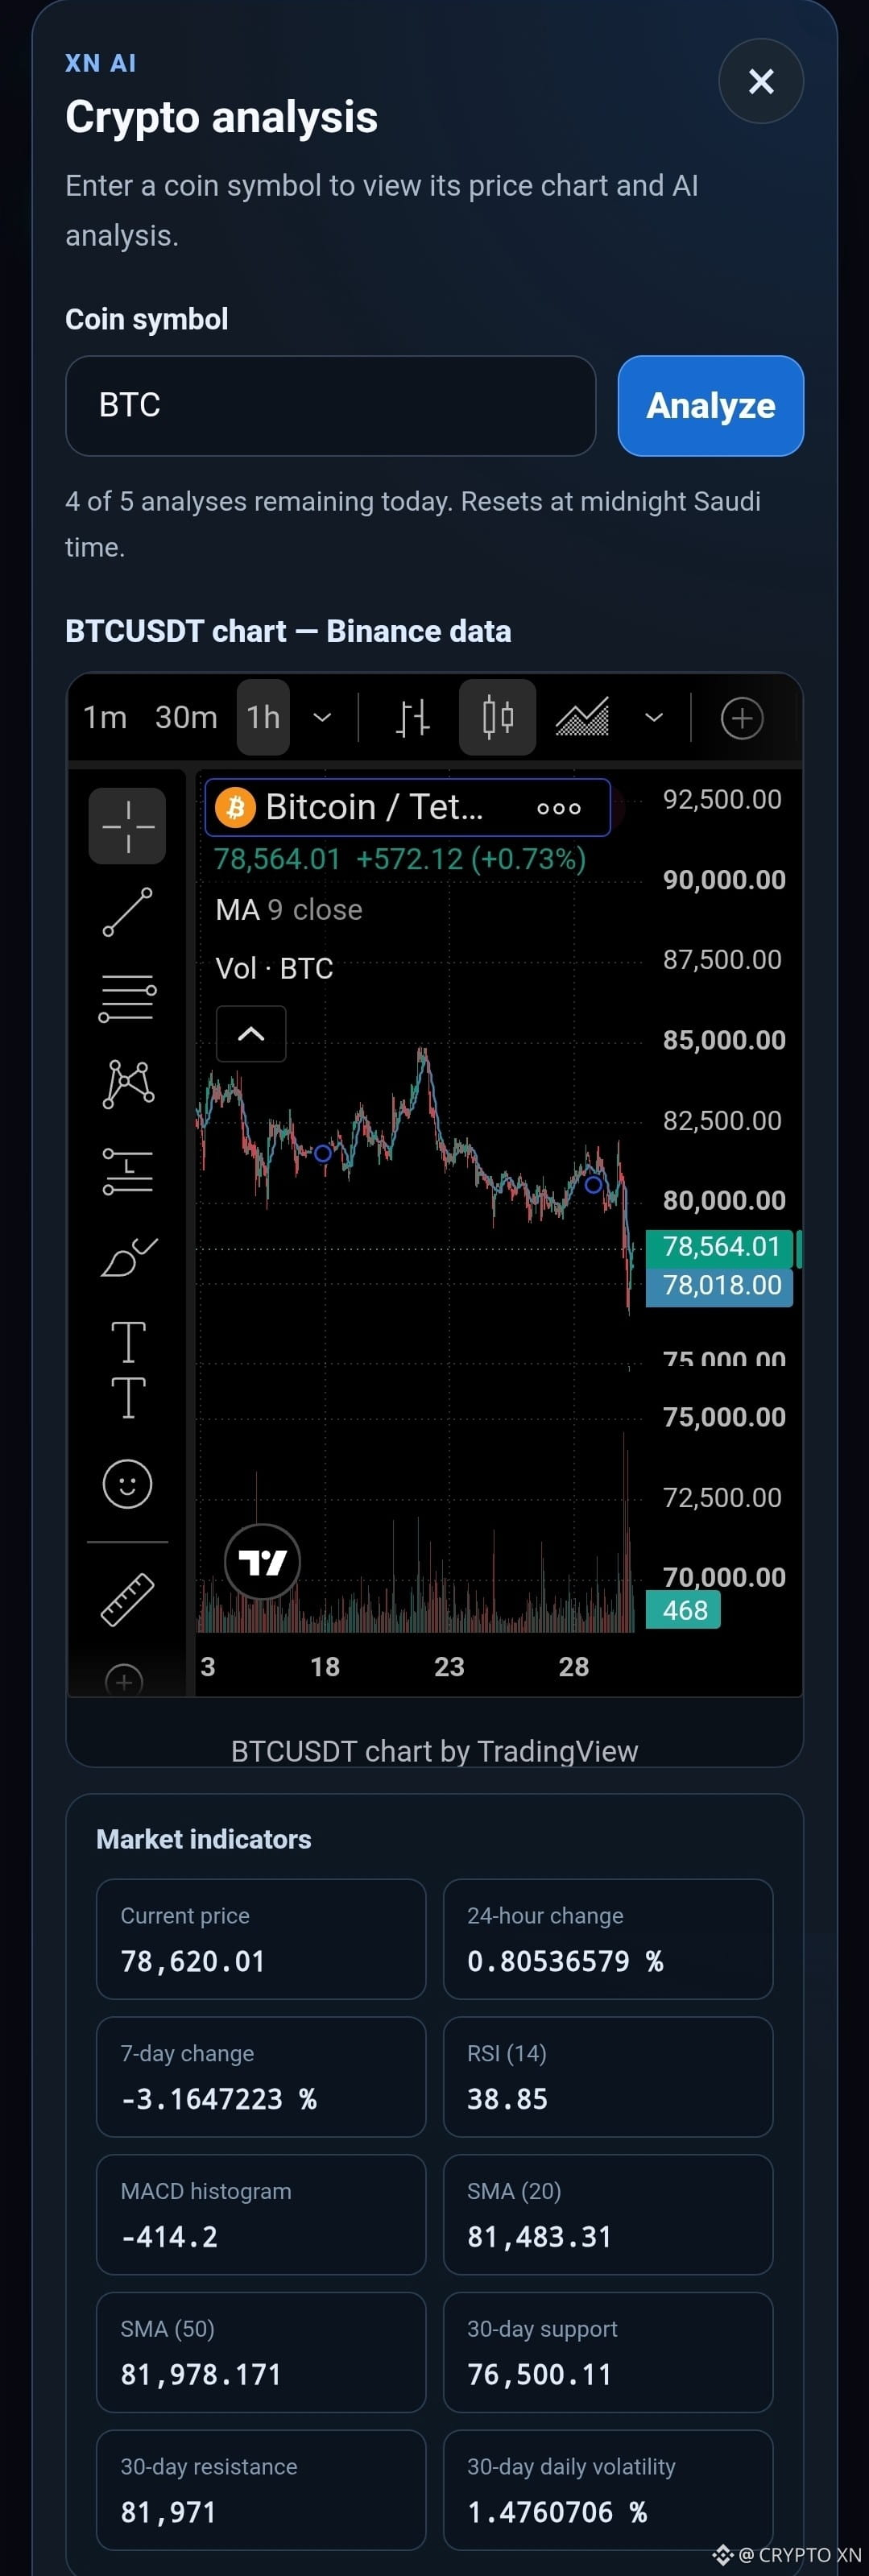
As of the latest close on October 30, 2026, Bitcoin (BTC) is trading at 78,620.01 USDT, reflecting a slight increase of 0.81% over the past 24 hours. However, the asset has experienced a decline of approximately 3.16% over the past week and about 5.98% over the last 30 days. This suggests a bearish trend in the medium term, as the price is below both the 20-day (SMA20) and 50-day (SMA50) simple moving averages, which are currently at 81,483.31 and 81,978.17, respectively.
Support and Resistance:
The immediate support level is identified at 76,500.11, which has held over the past 30 days. Conversely, the resistance level is situated at 81,971. If the price breaks below the support, it may indicate further bearish momentum. Conversely, a move above the resistance could signal a potential reversal or bullish trend.
RSI and MACD:
The 14-day Relative Strength Index (RSI) is at 38.85, suggesting that BTC is nearing oversold conditions, which could indicate a potential price rebound if buying interest increases. The MACD shows a bearish crossover, with the MACD line at -784.06 below the signal line at -369.86, indicating continued downward momentum in the short term.
Volatility:
The 30-day daily volatility is relatively low at 1.48%, suggesting that price movements have been stable but could change rapidly if market conditions shift.
Conditional Scenarios:
A bullish scenario would involve a breakout above the resistance level of 81,971, potentially leading to a test of the SMA20 and SMA50. Conversely, a bearish scenario could see a decline below the support level of 76,500.11, which may trigger further selling pressure.
Disclaimer:
This analysis is for educational purposes only and does not constitute investment advice. Past performance is not indicative of future results, and there are no guarantees of returns. Always conduct your own research before making investment decisions.