$TSLAB : Why Volume Can Mislead a Breakout
**Myth:** A price rise on the hourly chart automatically means a strong breakout if volume is above baseline.
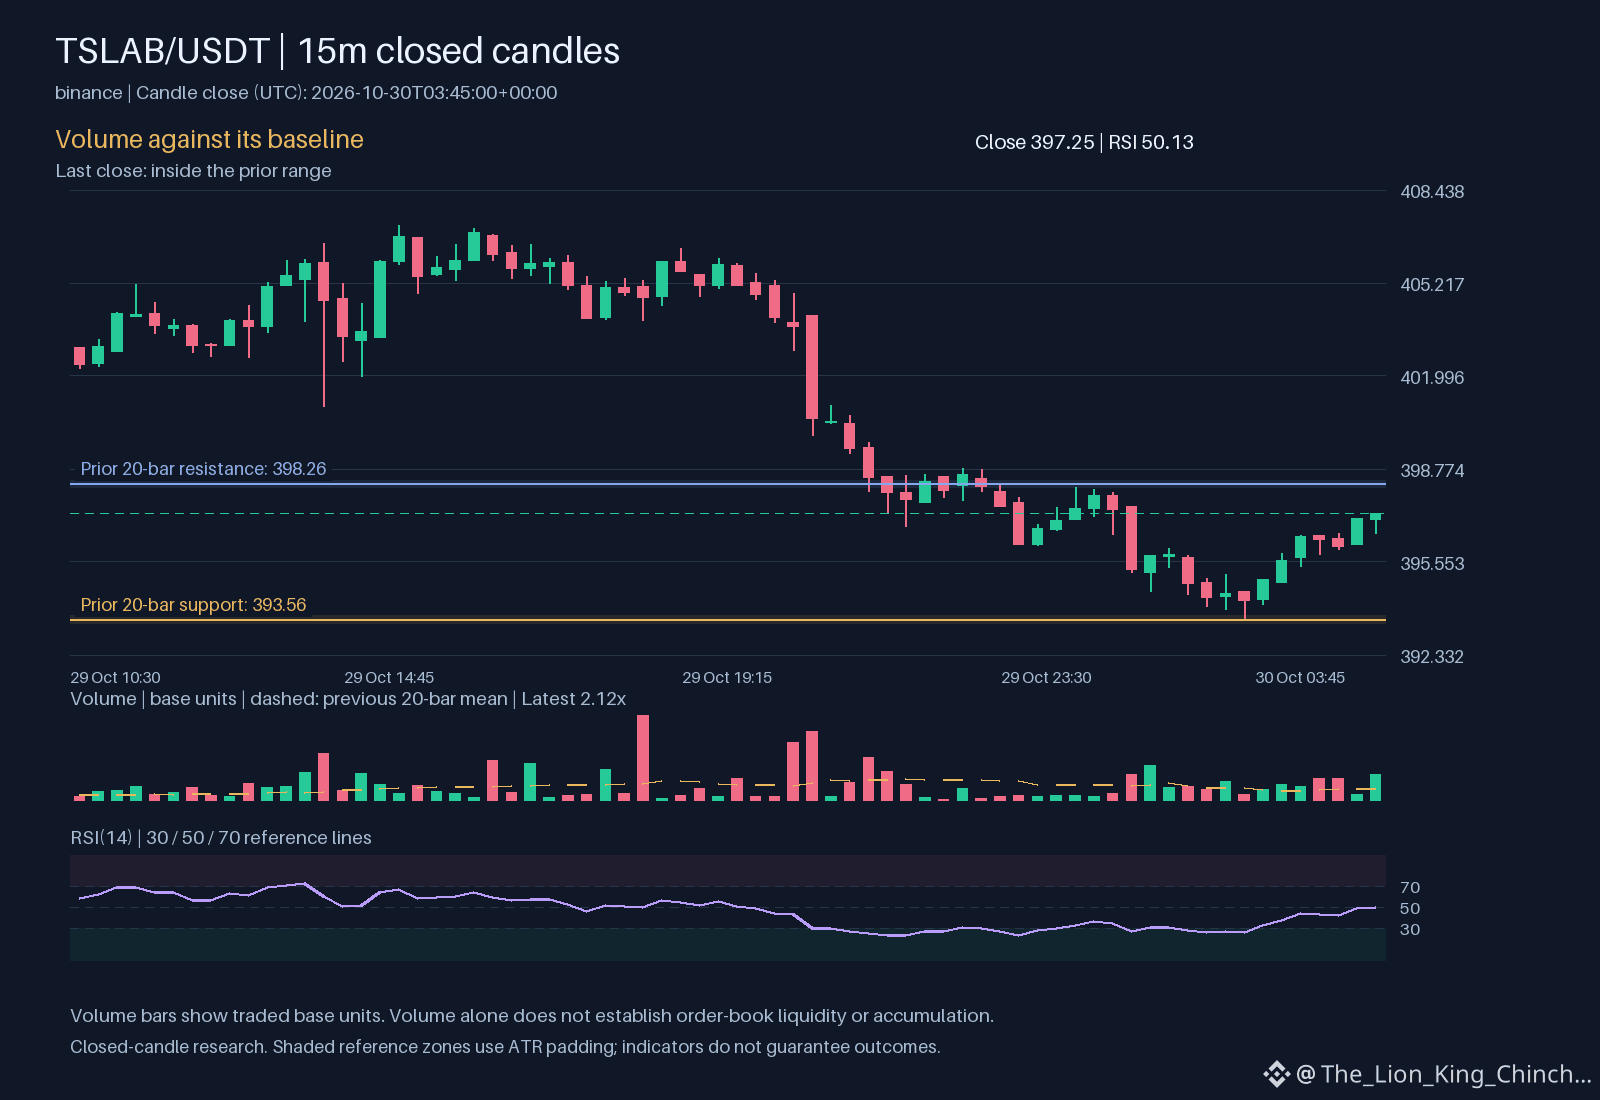
**Answer:** Volume above the usual level shows interest, but it does not guarantee that the price move will hold. When volume spikes, many traders are entering at the same time, which can create a temporary push. If the underlying order flow is not sustained, the price can reverse once the short‑term buying pressure fades. The observation for $TSLAB shows an hourly up direction while 2.11762 indicates volume above baseline. This pattern often appears when a few large buyers dominate the trade, inflating volume without broad participation.
**Mechanism:** Imagine a crowd trying to push a door open. If only a handful of strong people push, the door moves a little, but when they stop, the door swings back. In markets, a few large orders raise volume, but without many small participants, the price lacks a solid foundation. The market may retest the nearest support, often near the 393.56 level, or consolidate around the 401.537.
**Where it stops applying:** The explanation loses relevance when volume remains high for several periods and aligns with other confirming signals, such as a clear EMA crossover (396.669 above 398.83) or a rising RSI 50.1281. In that case, the broader participation suggests the move is more durable.
**Reassessment tip:** Track how volume changes after the initial rise. If 2.11762 drops back toward baseline while price stays up, consider tightening stops near the recent low or the 393.56 zone. This simple check helps separate a fleeting push from a genuine breakout.
Probabilistic market research, not a recommendation or guaranteed return.
Which trading assumption would you like to question next?
#TSLAB #CryptoLearning