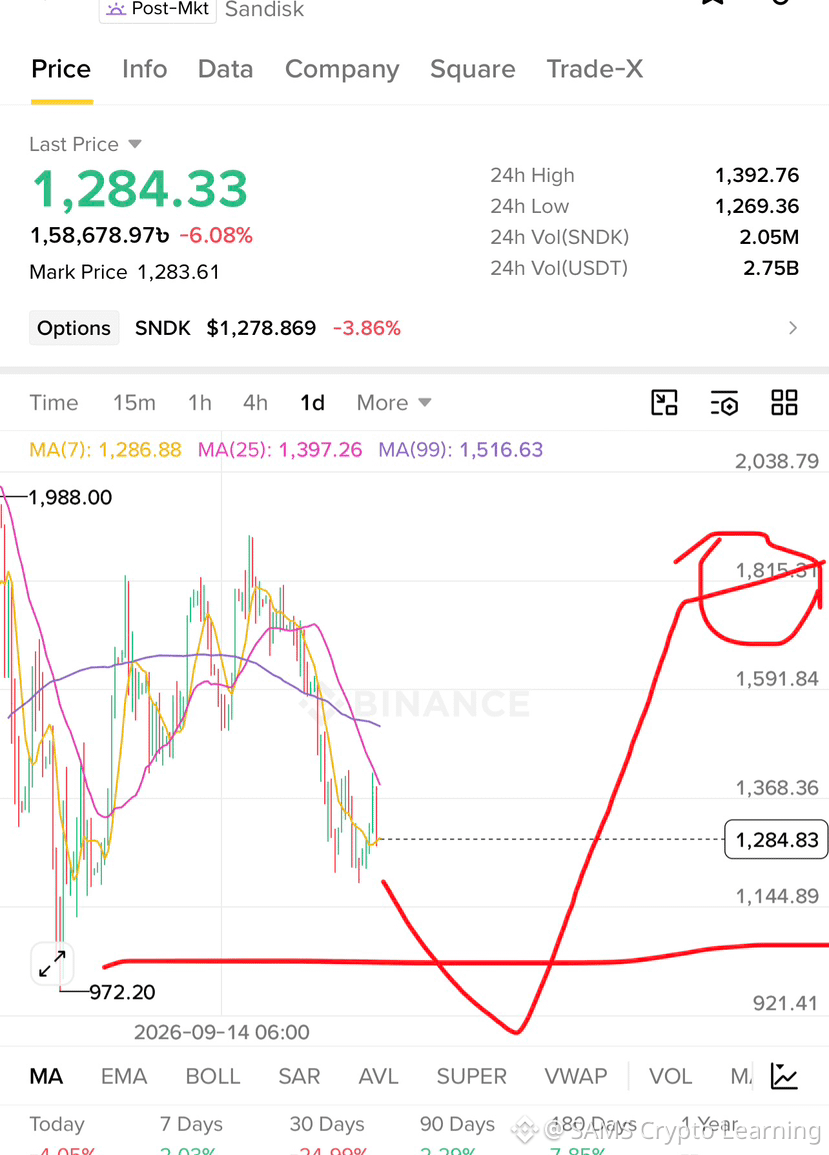
$SNDK
Market Analysis Summary
* Asset / Ticker: SNDK (Post-Mkt)
* Last Price: $1,284.33, down by -6.08% over the last 24 hours.
* 24-Hour Range:
* 24h High: $1,392.76
* 24h Low: $1,269.36
* Mark Price: $1,283.61
* 24h Trading Volume:
* SNDK: 2.05M
* USDT: 2.75B
Technical Indicators (Moving Averages)
* MA(7): 1,286.88
* MA(25): 1,397.26
* MA(99): 1,516.63
Chart Pattern & Overview
* The timeframe displayed is 1 day (1d).
* The chart shows a bearish downward trend in the short term, with the price currently resting at 1,284.33.
* The hand-drawn red illustration on the right suggests a speculative or projected "V-shape recovery" pattern, where the price drops near a support level and attempts a sharp rebound toward the 1,815.31 resistance zone.
* The moving averages (MA 7, 25, and 99) indicate that the shorter-term moving average is below the longer-term averages, reflecting ongoing downward pressure, though key support is being tested.