

INIT/USDT is at a critical point. After a strong upward move, Initia is showing signs that traders should watch closely. Will buyers push the price higher, or could profit-taking trigger a pullback?
Let's examine the available chart data.
📊 Current Market Snapshot
Trading Pair: INIT/USDT
Price: $0.21884
24H Change: +2.36%
24H High: $0.23857
24H Low: $0.20098
24H Trading Volume: Approximately $15.21M USDT
🔍 1H Chart: Short-Term Momentum
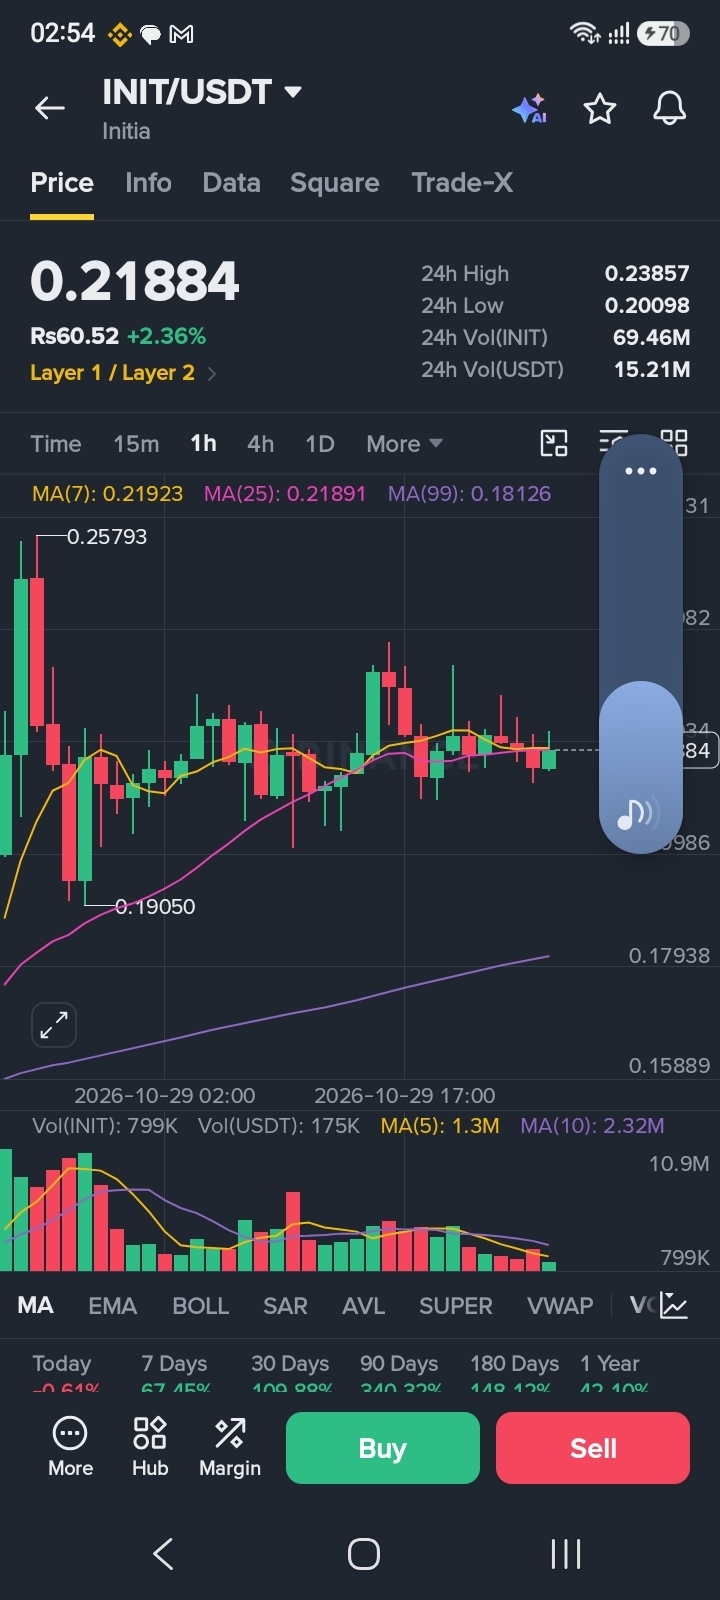
The price is trading around $0.21884, while the MA(7) and MA(25) are close to $0.21923 and $0.21891, respectively.
This suggests that short-term momentum is relatively balanced around the current price. A convincing move above the nearby moving averages could strengthen the short-term outlook, while rejection may signal further consolidation.
📈 1D Chart: The Bigger Picture
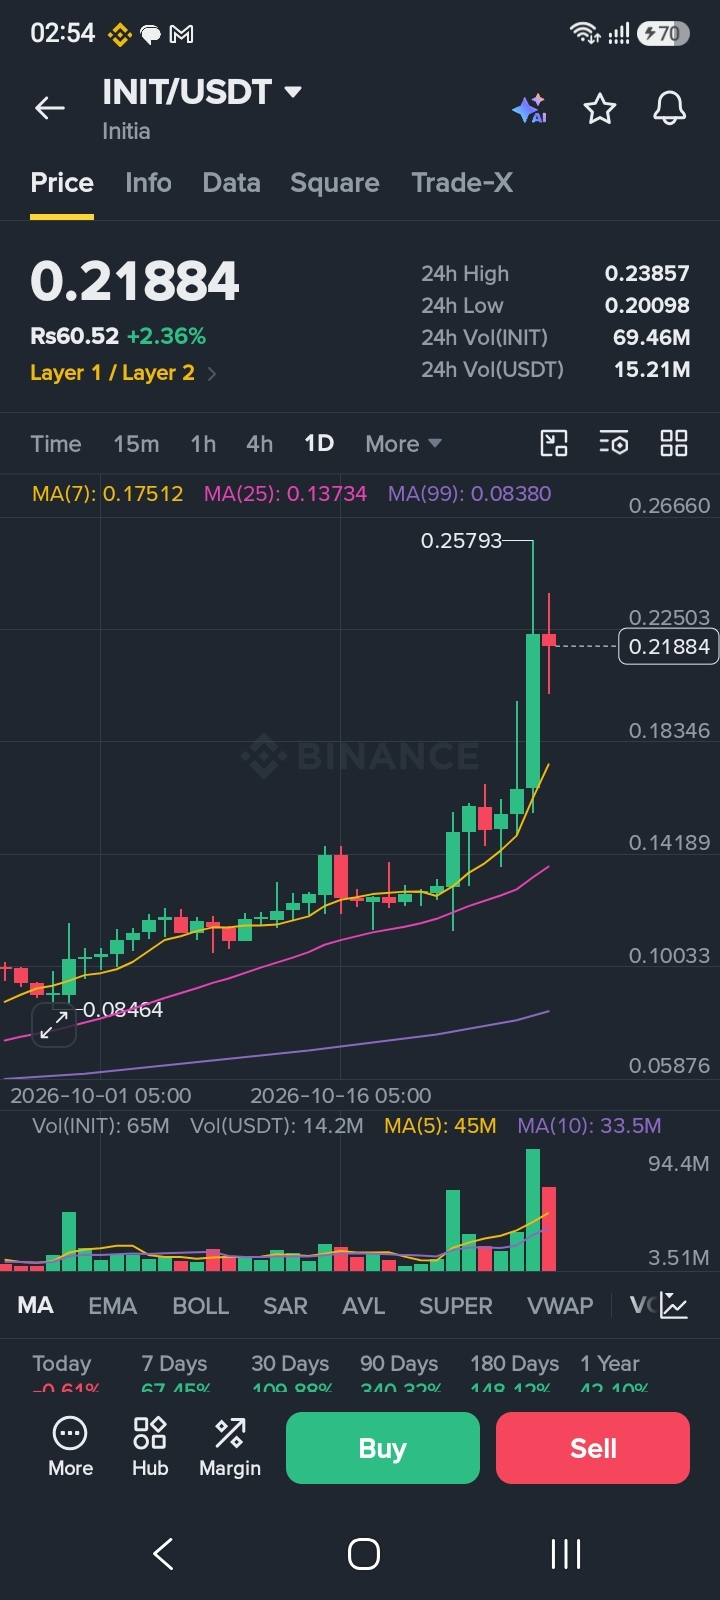
The daily chart shows a strong upward move, with the price well above the displayed MA(7), MA(25), and MA(99).
This indicates strong recent momentum, but it also means traders should be cautious about chasing a rally after a substantial increase. A pullback or sideways consolidation would not automatically invalidate the broader upward trend.
🎯 Key Levels to Watch
Resistance
$0.2250 — nearby price area to monitor
$0.23857 — recent 24-hour high
$0.25793 — a higher chart level to watch if momentum returns
Support
$0.2180–$0.2190 — immediate area around the current price and moving averages
$0.20098 — recent 24-hour low
$0.18346 — a lower daily-chart reference level
These are observational levels from the supplied screenshots, not guaranteed turning points.
🐂 Bullish Scenario
If INIT holds its nearby support area and buyers push the price above $0.2250, the recent high near $0.23857 could become the next test. A sustained breakout with stronger volume would provide more convincing evidence of renewed momentum.
🐻 Bearish Scenario
If the price loses the $0.2180–$0.2190 area and selling pressure increases, INIT could revisit $0.20098. A break below that level would raise the risk of a deeper correction.
💡 Final Thoughts
INIT is showing strong recent movement, but the next direction is not confirmed. The key question is whether buyers can turn nearby resistance into support or whether sellers will take control.
Would you expect INIT to break above $0.23857, or do you think a correction comes first? Share your analysis in the comments.
Disclaimer: This article is for educational and informational purposes only, based on the supplied chart screenshots. It is not financial advice. Cryptocurrency markets are highly volatile; always do your own research.
#INIT #Initia #CryptoAnalysis #BinanceSquare #Altcoins #TechnicalAnalysis #CryptoMarket