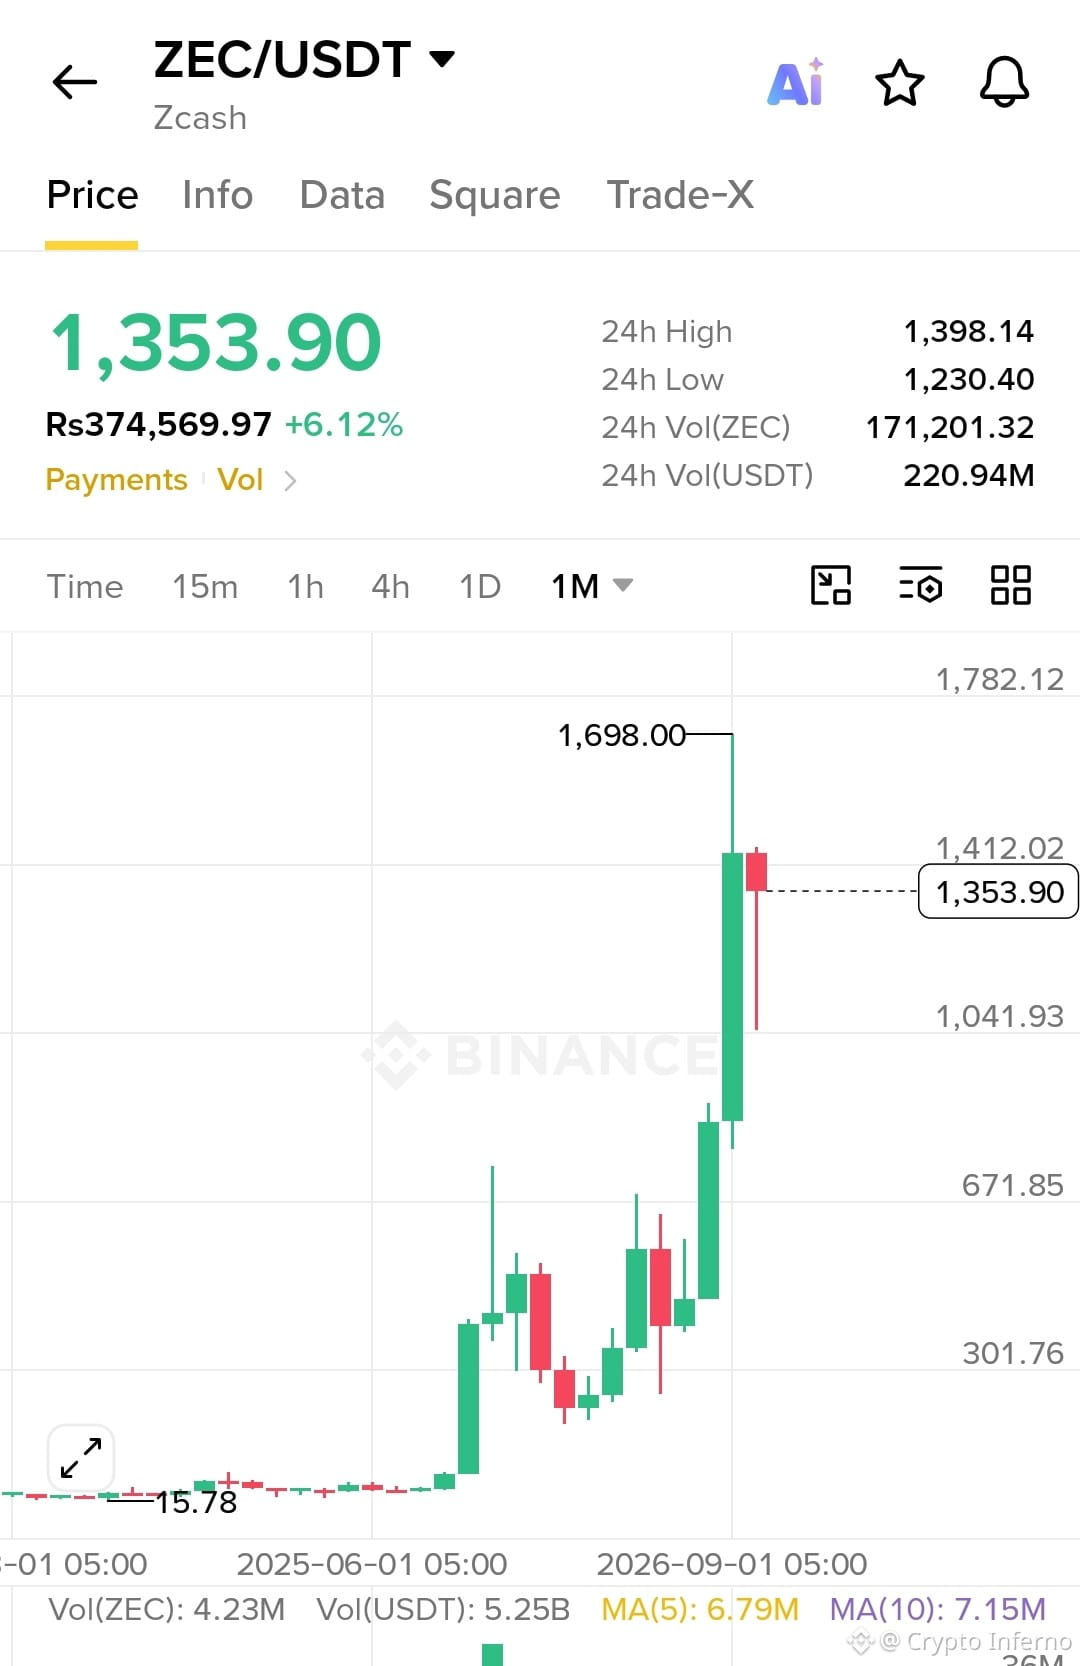
🚀 Bullish Momentum: $ZEC is trading at 1,353.90 USDT, up 6.12% in 24 hours, showing strong buying interest and high volatility.
📈 Macro Trend: The monthly chart indicates a massive breakout from prolonged accumulation near $15.78, followed by a parabolic rally toward $1,698.
🎯 Key Resistance Levels:
- 🔴 1,698–1,782 USDT — Major resistance zone.
- 🟢 1,041 USDT — Key support; holding above it would help maintain the bullish structure.
- 🟡 672 and 302 USDT — Lower supports if a deeper correction occurs.
⚠️ Market Outlook: ZEC remains bullish on the long-term chart, but the sharp rally increases the risk of profit-taking and a significant pullback.
💡 Conclusion: A sustained move above 1,698 USDT could signal further upside, while losing 1,041 USDT may weaken the bullish structure. Wait for confirmation and manage risk carefully. Not financial advice. DYO! 🔍