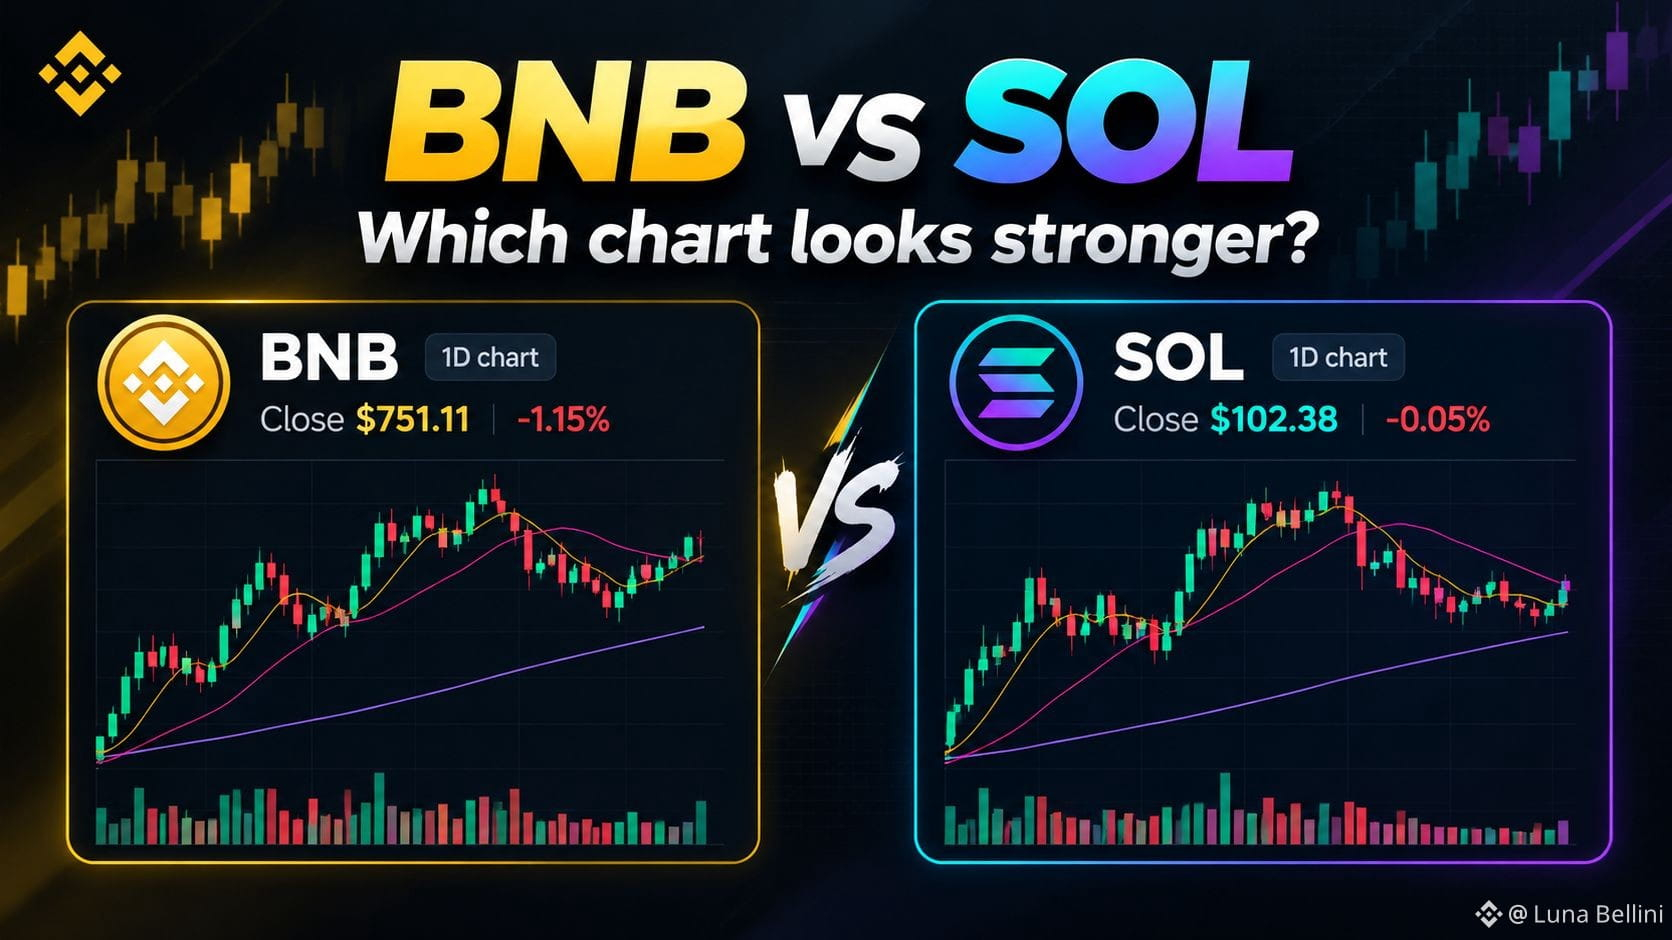
📊 BNB vs SOL: Which Chart Looks Stronger?
On the 1D chart, BNB is trading near $751.11, holding above its key moving averages. SOL is near $102.38, remaining below its 25-day moving average but above its 99-day average.
BNB shows relatively stronger short-term structure, while SOL needs to reclaim its 25-day average to improve momentum.
💬 Which one looks stronger to you? Share your analysis in the comments!
Not Financial Advice
$BNB $SOL