


🌍 Executive Market Context: Gold (XAU/USD) 📈
Gold (XAU/USD) is currently trading in a tight consolidation range around $4,040 – $4,055/oz. Following recent pullbacks from historic high-water marks, intraday volatility is primarily driven by U.S. Dollar (DXY) momentum, Treasury yield fluctuations, and shifts in Federal Reserve policy expectations.
🔍 Key Technical Takeaways
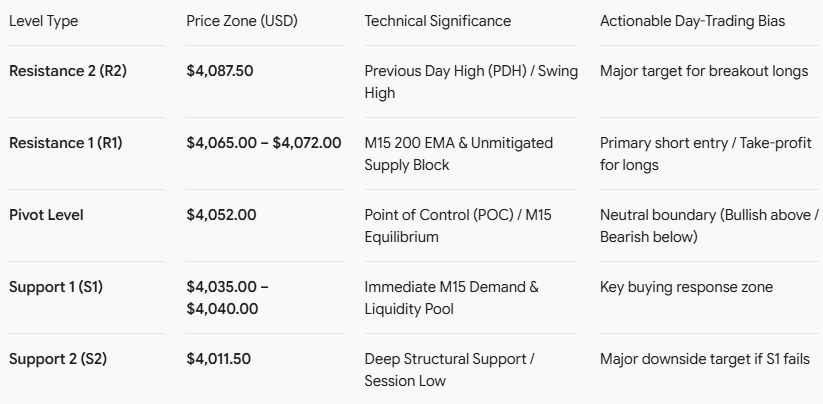
Trend & Moving Averages: Price is oscillating below the M15 200 EMA ($4,065), keeping intraday sellers in structural control during rally attempts.
Order Flow & Liquidity: Equal Lows (EQLs) established around the $4,035 – $4,040 zone represent sell-side liquidity (SSL). A sweep below this region before a quick reclamation signals a high-probability long scalp.
Key Resistance (Buy-Side Liquidity): The $4,065 – $4,072 supply block remains the primary overhead barrier guarding a trend reversal.
🎯 Technical Levels Matrix 📌
⚡ Concrete Actionable Trade Plan (Day Traders) 🧠
🟢 Scenario A: Long Play (Bullish Sweep & Reversal)
Trigger: Price sweeps below $4,038 into the $4,035 demand zone, then prints an M15 bullish engulfing candle or market structure shift (MSS) above $4,042.
Entry Zone: $4,040 – $4,043
Stop-Loss (SL): $4,032 (Below swing low)
Take-Profit (TP):
TP: $4,055 (Pivot)
TP: $4,068 (Resistance / FVG fill)
Risk/Reward: ~1:2.5
🔴 Scenario B: Short Play (Supply Rejection)
Trigger: Price rallies into the $4,065 – $4,070 supply zone and displays upper wick rejections on the M15 timeframe.
Entry Zone: $4,064 – $4,068
Stop-Loss (SL): $4,074 (Above supply block)
Take-Profit (TP):
TP: $4,050
TP: $4,038
Risk/Reward: ~1:2.8
📘 Playbook: Preparing for the Next Trading Session 🛠️
📍 Map the Session Extremes at Daily Close
Establish key structural anchors. Once the New York session finishes, mark down three critical reference price levels:
PDH & PDL: Previous Day High and Previous Day Low.
Asian Session Range: Note the High/Low formed between 00:00 UTC and 06:00 UTC, as London algorithms frequently target these boundaries for liquidity sweeps.
📅 Audit Upcoming High-Impact Economic Events
Prevent slippage around news releases. Review the economic calendar for high-impact USD events (e.g., US CPI, NFP, Federal Reserve Rate Decisions, or Initial Jobless Claims):
Mark exact release times on your chart.
Flat out or widen stops 15 minutes before Tier-1 USD news to avoid spread expansion.
🧭 Define Market Bias & Draw-on-Liquidity
Higher Timeframe (HTF) Alignment. Check the 4-Hour (H4) and 1-Hour (H1) charts to determine where major institutional liquidity sits:
If H4 is making lower highs, prioritize short entries on M15 pullbacks into premium zones.
If H4 holds structural support, look for M15 liquidity sweeps of daily lows for long setups.
🛡️ Pre-Set Position Sizing and Risk Boundaries
Capital Preservation First. Calculate position size based on exact pip distance for stop losses before entering the session:
Cap total session risk at 1% to 2% of overall trading equity.
Pre-define maximum daily drawdowns (e.g., stop trading for the day after 2 consecutive losses).
#GoldMarketAnalysis #IntradayDayTradingStrategy #XAUUSDTechnicalAnalysis