

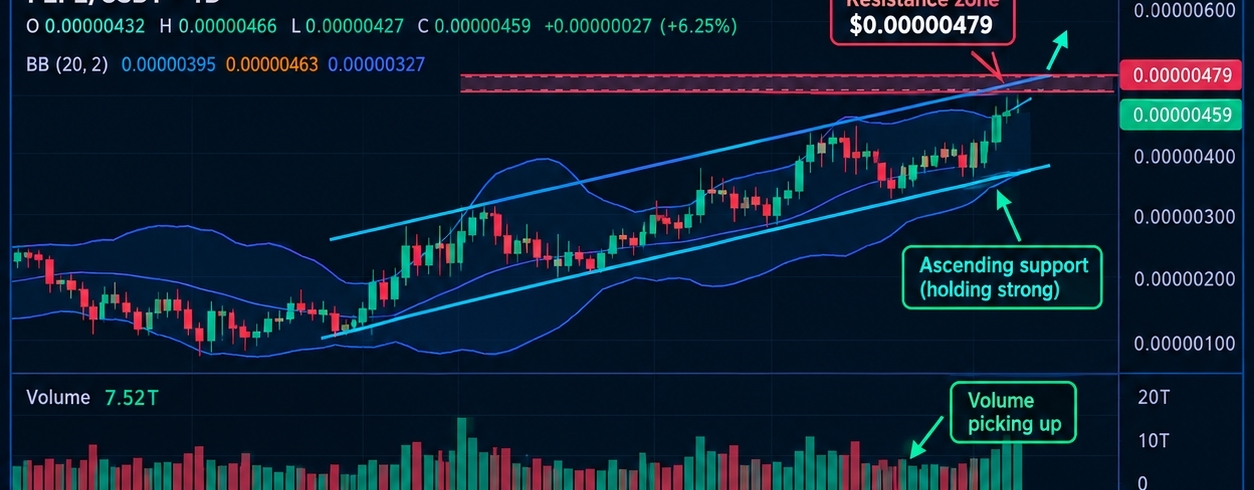
Binance Square Market Analysis | PEPE/USDT
The two PEPE/USDT chart screenshots—one on the 1-hour timeframe and one on the 4-hour timeframe—tell a complementary but cautious story. The short-term trend is still constructive, but the higher timeframe is stretched, and volume confirmation remains limited. For traders, this is a setup that requires patience rather than blind chasing.
1-Hour Chart: Trend Intact, but Volume Is Limited
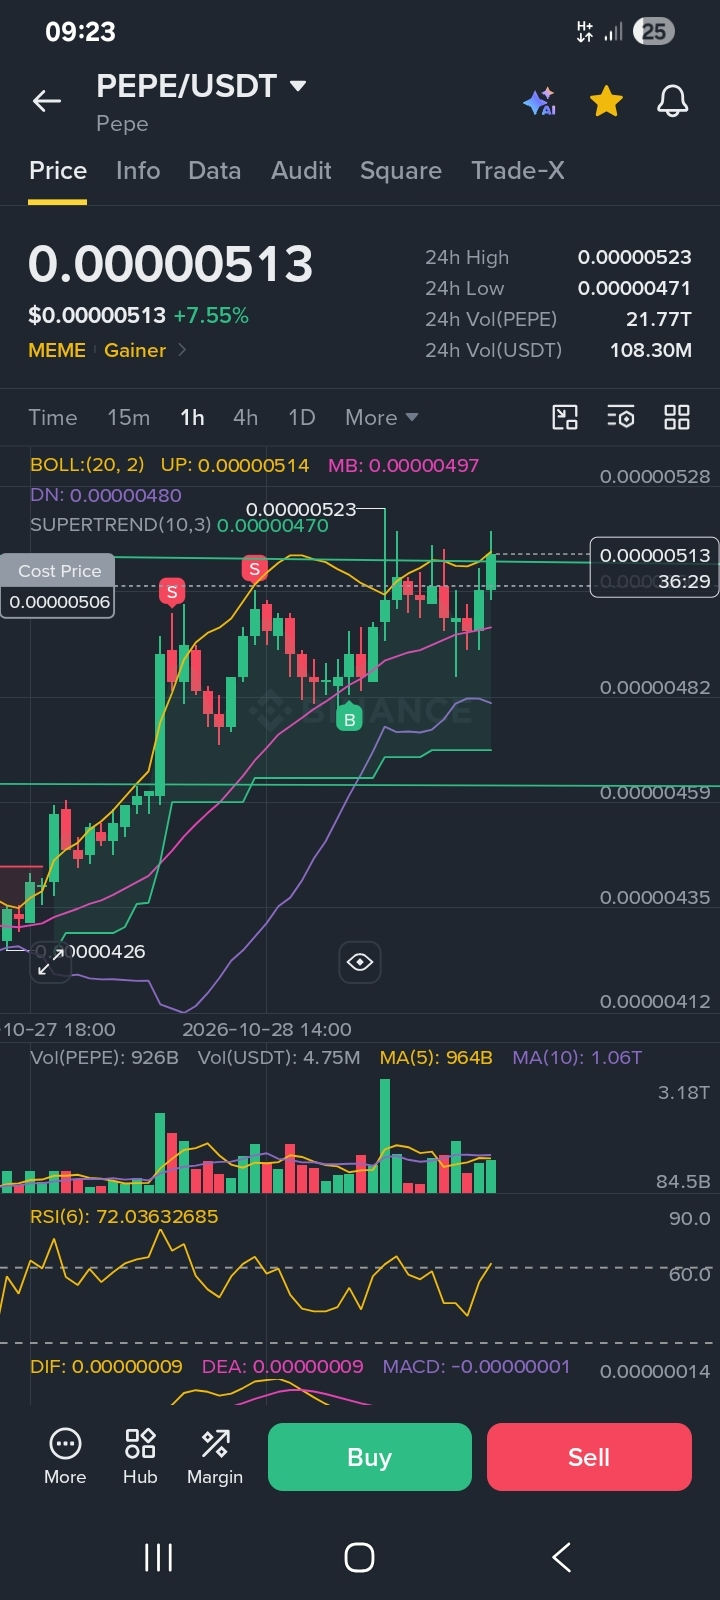
On the 1H chart, PEPE is trading around $0.00000508**, holding above the **1H EMA20 near $0.00000490. The 1H RSI is around 59, which is healthy: buyers are in control, but the timeframe is not yet overbought.
However, the rally toward $0.00000524 has come with limited trading participation. Volume has been well below average during the push, which means the move is easier to reverse than one backed by broad market demand.
Key 1H levels:
· Resistance: $0.00000523–$0.00000524
· Immediate support: $0.00000471
· Deeper support: $0.00000457
A 1H close above $0.00000524** with stronger volume would improve the breakout case. A close below **$0.00000471 would weaken the short-term structure.
---
4-Hour Chart: Strong Trend, Overbought Risk
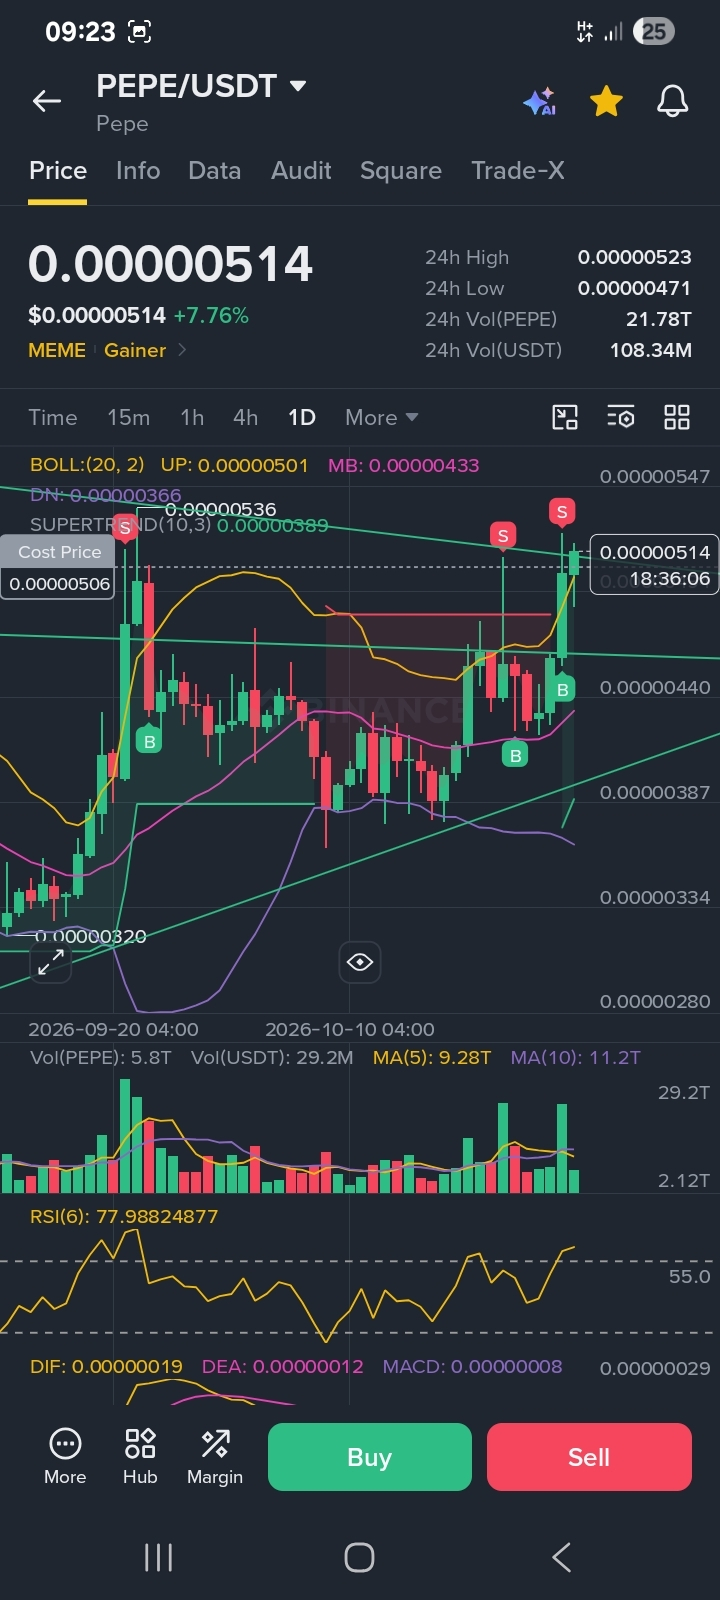
The 4H chart shows a stronger medium-term trend, with price above the 4H EMA20 at $0.00000465. But the 4H RSI is near 80, placing the timeframe firmly in overbought territory. That does not automatically mean the rally is over—meme coins can stay overbought—but it does mean the risk of a sharp pullback is elevated.
The critical 4H support is $0.00000457**, the origin of the recent impulse. If that level holds, the pullback can be treated as healthy. If it fails, the next structural support is **$0.00000421, and the short-term bullish thesis would be seriously weakened.
Key 4H levels:
· Resistance: $0.00000524
· Critical support: $0.00000457
· Structural support: $0.00000421
· Trend filter: 4H EMA20 at $0.00000465
---
Confluence: The Levels That Matter
Both timeframes point to the same decision zone. $0.00000524** is the shared resistance ceiling, and **$0.00000457–$0.00000471 is the shared support band.
The bullish confirmation would be three consecutive 1H closes above $0.00000524 with volume expanding to at least average levels. Without that, a breakout attempt may be a liquidity grab rather than a genuine trend continuation.
The bearish invalidation would be a 1H close below $0.00000471**, which would bring **$0.00000457 into focus.
---
Bottom Line
PEPE’s 1H chart says the short-term trend is still up. The 4H chart says the move is overbought and vulnerable to a shakeout. With volume confirmation still limited, the highest-probability outcome is consolidation or a controlled pullback—not a straight-line continuation.
Traders should watch $0.00000524** for breakout confirmation and **$0.00000457 for structural risk. Until one of those levels breaks with volume, patience is the better edge.
This article is for educational and informational purposes only and does not constitute financial advice. Meme coins are highly volatile; always do your own research and manage risk accordingly. #BTC走势分析 #Ethereum #BNB走势 #PEPE #bnb