

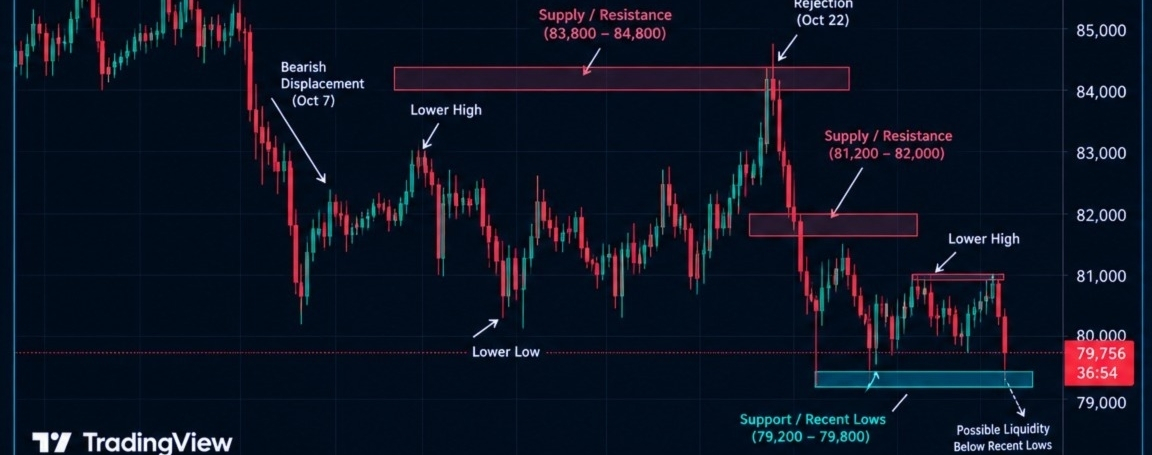

Current Price: 79,756
H4 Bias: Bearish
Structure State: A sustained October downtrend has produced lower highs and lower lows, with renewed bearish displacement after rejection from 83,800–84,800 and price declining toward the 79,200–79,800 support region.
Market Structure
BTCUSD remains in a bearish H4 structure following the decline from the early-October highs around 86,000–87,000. The bearish displacement on 7 October established downside momentum, and the subsequent rejection from 83,800–84,800 on 22 October reinforced the sequence of lower highs.
The latest decline has brought price to 79,756, within the 79,200–79,800 recent-low region. The market is approaching sell-side liquidity, so the immediate downside opportunity must be evaluated against the possibility of a temporary rebound. A sustained break below 79,200 would confirm further weakness, while a reclaim of 81,200–82,000 would improve the recovery outlook.
Key Resistance
Immediate Resistance: 81,200–82,000 — intermediate resistance and the nearest meaningful recovery threshold.
Major Supply: 83,800–84,800 — previous rejection area and principal overhead supply.
Higher Resistance: 86,000–87,000 — early-October swing-high region.
Key Support
Immediate Support: 79,200–79,800 — recent lows and current downside reaction area.
Lower Support: A confirmed break below 79,200 would expose further downside; the next exact objective is not specified in the chart's key-level panel.
FVG — Fair Value Gap
The bearish displacement on 7 October and renewed decline after 22 October provide potential bearish imbalance areas. Retracements into the 81,200–82,000 region should be monitored for rejection, but the exact unfilled FVG boundaries must be verified against the original candles.
Order Block (OB)
The 83,800–84,800 supply region is the principal bearish order-block candidate associated with the recent rejection. The 81,200–82,000 region is nearer-term resistance. The 79,200–79,800 area is the immediate support and liquidity region rather than a confirmed bullish order block.
Liquidity Map
Buy-side liquidity (BSL): Above 82,000 and the major 83,800–84,800 supply zone.
Sell-side liquidity (SSL): Beneath 79,800 and around the 79,200 recent-low boundary.
Trade Scenarios
Bearish continuation: Rejection from 81,200–82,000 followed by a confirmed break below 79,200 would support further downside.
Bullish recovery: Reclaim 81,200–82,000 and establish sustained H4 acceptance. A further recovery toward 83,800–84,800 would require continued bullish displacement and a successful retest.
Trendline
The descending sequence of lower highs and lower lows maintains bearish pressure. A bullish reversal requires a confirmed break of the latest lower high and subsequent higher-low formation.
Invalidation
A sustained H4 close above 84,800 would weaken the prevailing bearish structure. A confirmed breakdown below 79,200 would invalidate the immediate recovery scenario.
Professional Summary
Primary bias: Bearish.
Current price: 79,756.
Immediate resistance: 81,200–82,000.
Major supply: 83,800–84,800.
Immediate support: 79,200–79,800.
Bearish trigger: Confirmed H4 break below 79,200.
Recovery trigger: Sustained reclaim of 81,200–82,000.
Risk Consideration: BTCUSD is testing the recent-low region after sustained selling. Avoid chasing shorts directly into 79,200–79,800 without confirming whether sell-side liquidity has already been swept.