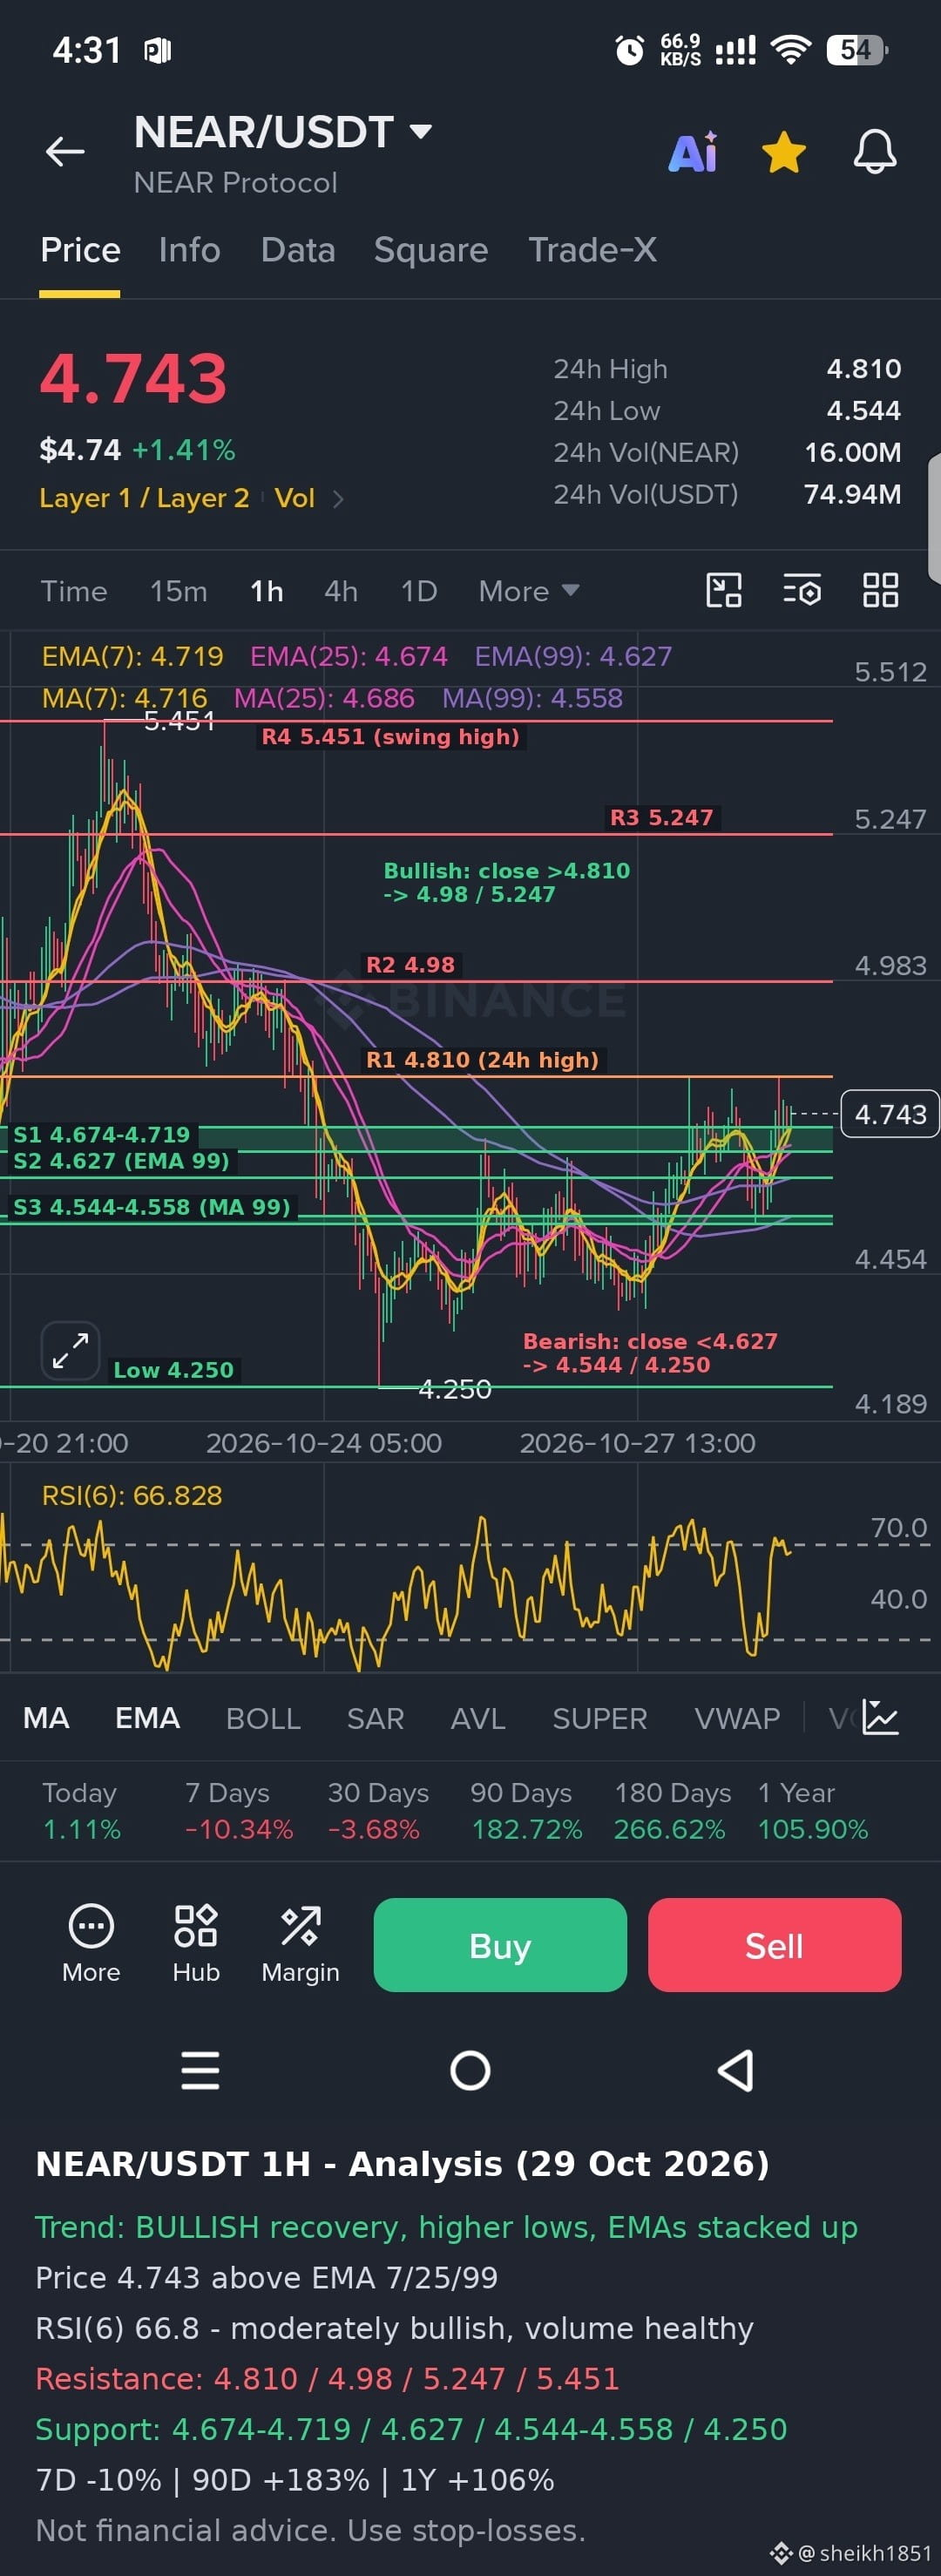
$NEAR **NEAR/USDT (1H) – Quick Analysis**
**Trend:** Bullish recovery after a deep pullback. Price (4.743) is above EMA(7) 4.719, EMA(25) 4.674 and EMA(99) 4.627, with the averages stacked in bullish order. It bottomed near 4.250, based a long time around 4.45 to 4.55, and has since made higher lows, pushing back above the downward-sloping 99 averages. It is still well below the 5.451 peak, and it is down about 10% over 7 days, so this is a recovery rather than a new uptrend. The bigger picture is strong: up about 183% over 90 days, 267% over 180 days and 106% over one year.
**Momentum:** RSI(6) is about 66.8, which is moderately bullish and close to overbought but not stretched. Volume is healthy (about 74.9M USDT), which supports the bounce. Price is only slightly above EMA(7), so it isn't extended.
**Key levels:**
- **Resistance:** 4.810 (24h high), then roughly 4.98, then 5.247 and the 5.451 swing high.
- **Support:** 4.716 to 4.719 (EMA/MA 7), then 4.674 to 4.686 (EMA/MA 25), then 4.627 (EMA 99). Below that, 4.558 (MA 99), 4.544 (24h low) and the 4.250 low.
**Outlook:** The bias is bullish while price holds above 4.67. A 1H close above 4.810 with rising volume would confirm the breakout and open 4.98. A pullback to 4.67 to 4.72 that holds would be a normal reset. A close below 4.627 would weaken the structure, and below 4.544 would put the 4.25 low back in play.
This is a technical read not financial advice. Use stop-losses and keep position sizes small.
#EarningsSeason #FOMCWatch
**Trend:** Bullish recovery after a deep pullback. Price (4.743) is above EMA(7) 4.719, EMA(25) 4.674 and EMA(99) 4.627, with the averages stacked in bullish order. It bottomed near 4.250, based a long time around 4.45 to 4.55, and has since made higher lows, pushing back above the downward-sloping 99 averages. It is still well below the 5.451 peak, and it is down about 10% over 7 days, so this is a recovery rather than a new uptrend. The bigger picture is strong: up about 183% over 90 days, 267% over 180 days and 106% over one year.
**Momentum:** RSI(6) is about 66.8, which is moderately bullish and close to overbought but not stretched. Volume is healthy (about 74.9M USDT), which supports the bounce. Price is only slightly above EMA(7), so it isn't extended.
**Key levels:**
- **Resistance:** 4.810 (24h high), then roughly 4.98, then 5.247 and the 5.451 swing high.
- **Support:** 4.716 to 4.719 (EMA/MA 7), then 4.674 to 4.686 (EMA/MA 25), then 4.627 (EMA 99). Below that, 4.558 (MA 99), 4.544 (24h low) and the 4.250 low.
**Outlook:** The bias is bullish while price holds above 4.67. A 1H close above 4.810 with rising volume would confirm the breakout and open 4.98. A pullback to 4.67 to 4.72 that holds would be a normal reset. A close below 4.627 would weaken the structure, and below 4.544 would put the 4.25 low back in play.
This is a technical read not financial advice. Use stop-losses and keep position sizes small.
#EarningsSeason #FOMCWatch