BNB/USDT 1H Analysis: Bulls Push Toward $760 Resistance 📈
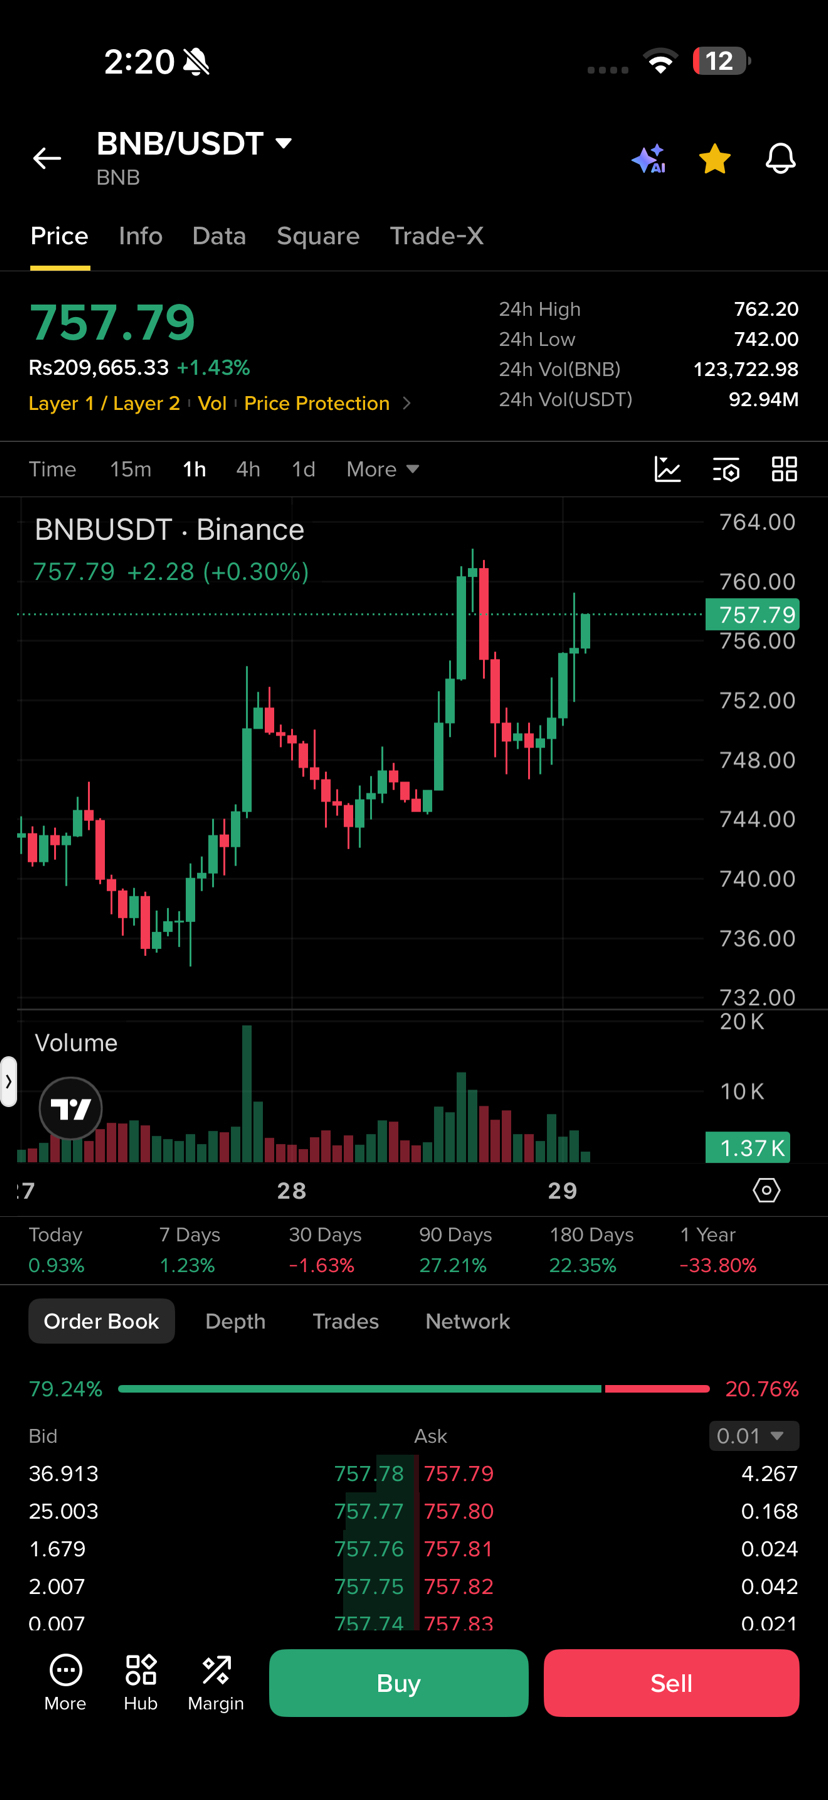
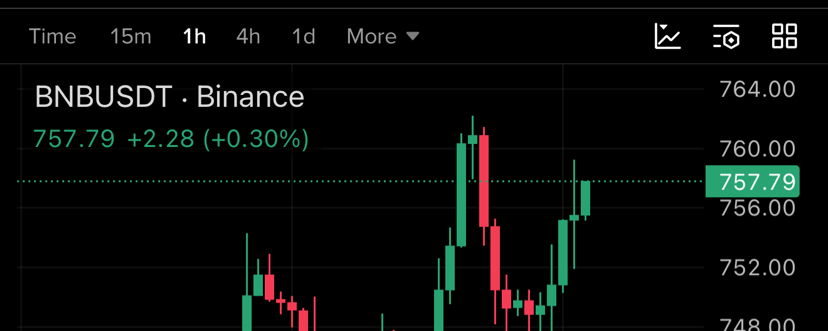
BNB is currently trading around $757.79, showing positive momentum on the 1-hour chart. The price has recovered strongly from the recent $736–$740 area and is now approaching an important resistance zone around $760–$762.
📊 Technical View
On the 1H chart, BNB has formed a clear short-term recovery. After dropping toward the $736 area, buyers stepped in and pushed the price higher. The recent candles show renewed buying pressure, with BNB moving back above the $752 level.
The next major challenge for bulls is the $760–$762 resistance zone. A strong breakout and close above this area could open the door toward higher levels.
🔑 Key Levels
Resistance:
• $760–$762
• $764+
Support:
• $752
• $748
• $744
If BNB holds above $752, the bullish structure could remain intact in the short term. However, rejection around $760–$762 could lead to a pullback toward the nearby support levels.
📈 Market Momentum
BNB is currently showing positive short-term momentum, with the price up around 1.43% over 24 hours. The recent recovery and consecutive green candles suggest that buyers are currently active.
Still, traders should watch the $760–$762 zone carefully. A breakout with strong volume would provide more confirmation of continued upside momentum, while a rejection could result in consolidation or a short-term retracement.
Overall: BNB remains technically constructive on the 1H timeframe, but the $760–$762 area is the key level to watch next. 👀
#BNBUSDT #crypto #Binance #Trading #TechnicalAnalysis $BNB