The $SOL
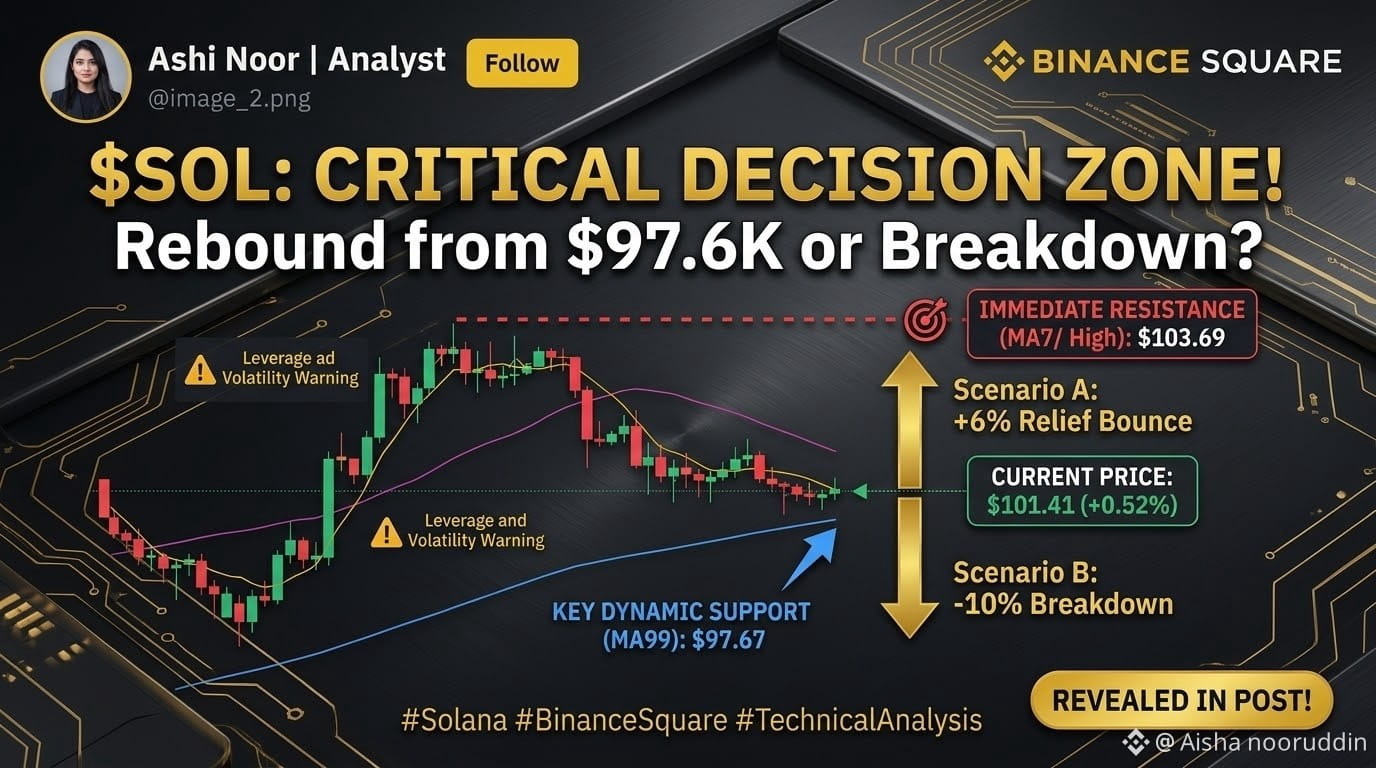
/USDT is the technical battleground today, currently trading at $101.41 (+0.52%) as price action consolidates just above crucial macro support. Solana is compressed between dynamic moving average clusters, setting up a major breakout or breakdown opportunity. Are we looking at a relief bounce or further downside?
📊 Technical Analysis & Core Indicators:
* Consolidation Pattern: Following the swift correction from $125+, $SOL has entered a tight consolidation range between $98 and $104. Look at that immediate price floor holding at $98.62 on the chart.
* Moving Average Clusteter:
* Overhead Resistance (MA7 & High): Immediate selling pressure is found near the intraday high of $103.69 and the short-term 7-day Moving Average (yellow line).
* Dynamic Floor (MA99): broader structural support is sitting right below current price action at $97.67 (purple MA line). A daily close below this line invalidates the immediate recovery thesis.
💡 Trade Setup & Key Scenarios:
Here are the potential scenarios for the next few sessions:
* Scenario A: Bullish Relief Bounce (+6%): Look for an accumulation bounce from the MA99 support floor. A daily candle close above immediate high resistance at $103.69 confirms bullish recovery momentum toward immediate mid-range targets near $110+.
* Scenario B: Bearish Breakdown (-10%): Failure to regain the MA(7) near $102 could trigger heavy selling pressure. If $SOL prints a decisive daily close below the dynamic baseline support at $97.67, expect a breakdown acceleration toward deeper demand zones near $90 and $85.
👇 Community Discussion:
Is Solana leading the Layer 1 bounce back to $110, or are you waiting for a deep retest of $90 first? Drop your trades and profit targets below! 👇
📌 Follow @Ashi Noor | Analyst for daily high-impact technical alpha!
#Write2Earn #BinanceSquare #Solana #SOL #TecnicalAnalysis #Layer1 #CryptoTrading $[SOL]