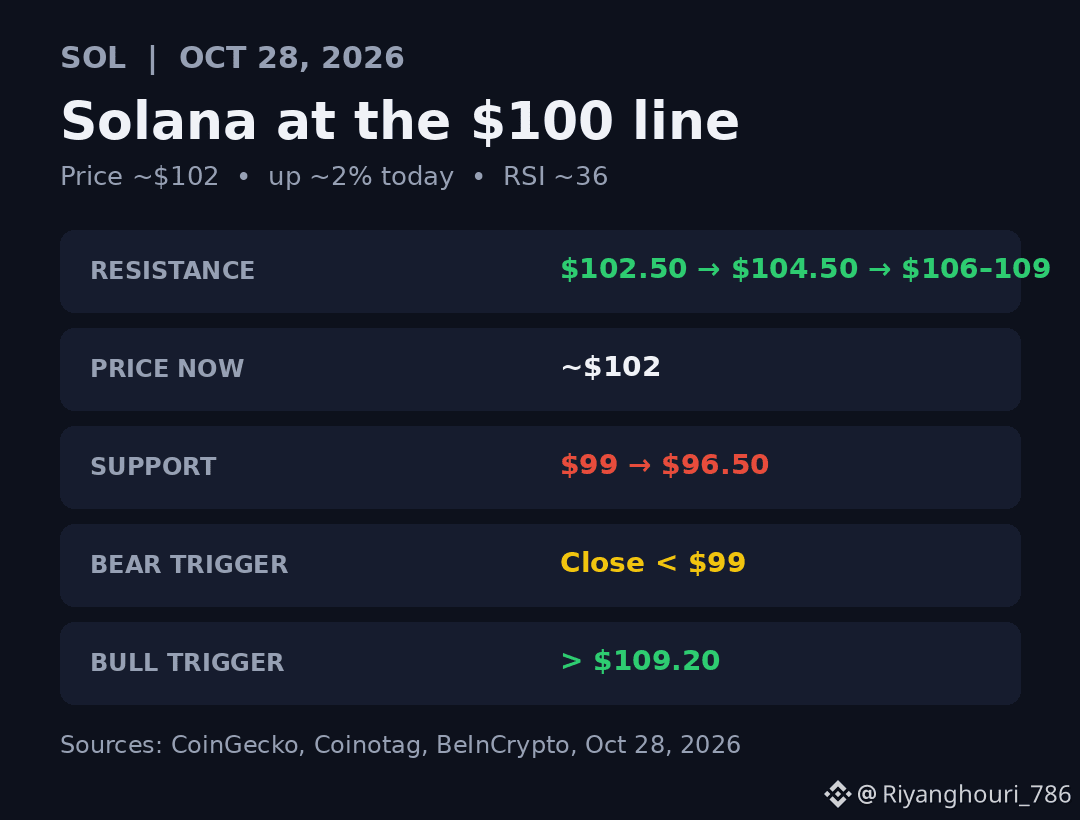
Solana is the chart I keep coming back to tonight, and not because it's running — it's up only about 2% to roughly $102. It's because $100 is holding, but only just, and the two stories fighting over that level are both credible.
On the bearish side, the money flow is ugly. US spot Solana ETFs lost $19.16 million on Tuesday, their worst day since December, and October outflows are around $72 million. BeInCrypto flagged a possible head-and-shoulders pattern with its neckline right at $100 — a daily close below it would confirm the pattern and, on that reading, put $80 in play. The daily RSI near 36 backs up the softness: this is a bounce, not strength, until proven otherwise.
On the other side, the fundamentals quietly improved last week. The Alpenglow upgrade went live on October 21, cutting finality from about 12.8 seconds to roughly 150 milliseconds, and it has run without an outage. And seasonally, November has historically been kind to Solana, with a median gain of 15.3% since 2020 — though I have to be honest that last November broke that pattern badly, falling 28% even as ETFs pulled in record money. History rhymes; it doesn't promise.
So here's how I'm playing it, and this is analysis, not a call: I lean cautiously constructive above $100, but I don't trust the reclaim until Solana closes a day above $102.50, with $104.50 and the 50-day average near $106–109 above that. If it closes below $99, my lean is wrong and I step aside — and a break above $109.20 would, by MCO's count, undo the bearish case entirely.
The Fed decision tonight could decide this before the chart does. A hawkish surprise probably tests $99 fast; a soft tone could hand Solana the $102.50 break on a plate. Which side are you leaning — is $100 the floor that holds into November, or the neckline that breaks? Not financial advice. $SOL