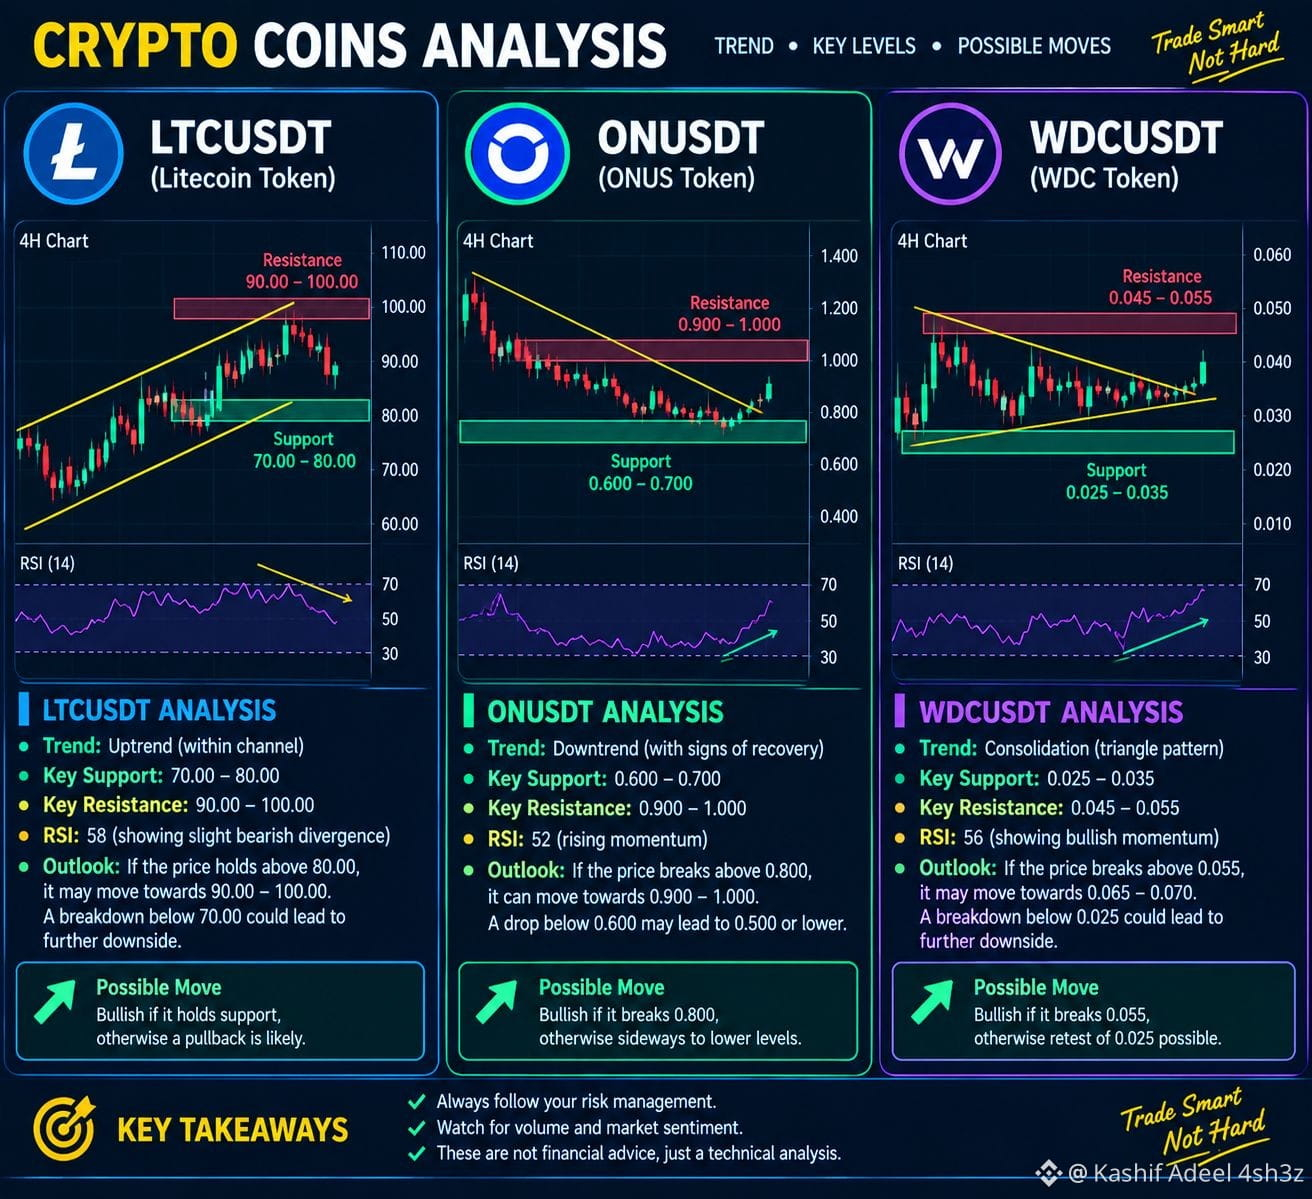
$LTC is showing an upward trend within its trading channel, although recent selling pressure suggests a possible short-term pullback. The key support zone is around 70–80, while resistance lies between 90 and 100. If the price holds above support, it may move toward the resistance zone; however, a breakdown below support could lead to further downside.$ONDS is currently showing a downward trend but displaying signs of a potential recovery, with improving momentum suggesting a possible bullish reversal. Its key support zone is around 0.600–0.700, while resistance is located between 0.900 and 1.000. A sustained breakout above nearby resistance could strengthen bullish momentum, whereas a drop below support may lead to further losses.$WDC is consolidating in a narrowing triangle pattern, indicating that a breakout may be approaching. Its key support zone is around 0.025–0.035, while resistance lies between 0.045 and 0.055. A breakout above resistance with strong trading volume could open the way for further gains, while a breakdown below support may signal additional downside. These price levels are based on the earlier illustrative chart and are not verified live market data, so always check current market prices and apply proper risk management before trading.
#LTC #on #wdc #BTC #Write2Earn
#LTC #on #wdc #BTC #Write2Earn