


Date: October 28, 2026
1. Current Market Overview
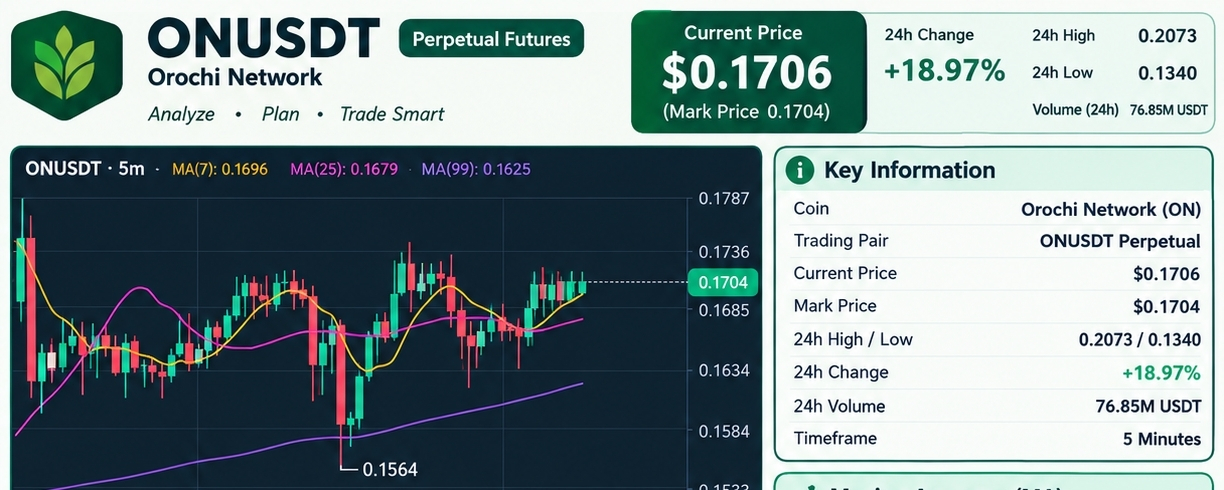
$ON USDT is currently trading at approximately $0.1706, showing a gain of 18.97% over the last 24 hours.
The 24-hour high is $0.2073, while the low is $0.1340. The coin has experienced significant price movement, but traders should remain cautious because strong rallies can also be followed by sudden corrections.
2. Technical Analysis
The current price is above all three moving averages, indicating a bullish short-term structure.
MA(7): $0.1696
MA(25): $0.1679
MA(99): $0.1625
The moving averages are aligned bullishly, with MA(7) above MA(25) and MA(99). This suggests that buyers currently have an advantage in the short-term trend.
However, the price is consolidating near $0.1700–$0.1710, and additional buying pressure may be needed for a successful breakout.
🎯 3. Important Support and Resistance Levels
Resistance Zone: $0.1735–$0.1740
This is an important area where the price has previously faced selling pressure. A strong breakout above this zone, supported by increased trading volume, could open the way for another upward move.
Immediate Support: $0.1700–$0.1705
This area is close to the current price and may help stabilize the market during short-term consolidation.
Support Zone: $0.1685–$0.1690
If the price pulls back, traders should watch this area for signs of buying interest.
Additional Support: $0.1675–$0.1680
This zone is close to MA(25) and may become important if selling pressure increases.
Stronger Support: $0.1625–$0.1635
This area is near MA(99) and previous price activity. A deeper correction could bring the price toward this zone.
Previous Swing Low: $0.1564
This is the lowest price marked on the visible chart and represents an important historical level within the displayed price action.
🟢 4. Possible Long Trade Scenario
A Long trade may become more attractive if buyers successfully push the price above the $0.1735–$0.1740 resistance zone.
Before considering an entry, watch for the following confirmations:
✅ The price holds above $0.1690.
✅ A 5-minute candle closes above $0.1740.
✅ Trading volume increases during the breakout.
✅ The price maintains its position above the broken resistance.
If a breakout is confirmed, potential upside levels to monitor are $0.1760, $0.1780, and $0.1800.
These are possible technical targets, not guaranteed price predictions. A failed breakout could quickly reverse the price.
🔴 5. Possible Short Trade Scenario
A Short setup may become worth evaluating if the price fails to break resistance and selling pressure increases.
Watch for these warning signs:
❌ Repeated rejection near $0.1735–$0.1740.
❌ A 5-minute candle closes below $0.1685.
❌ Selling volume increases.
❌ The price moves below MA(7) and MA(25).
If bearish momentum develops, potential downside levels to monitor are $0.1670, $0.1650, and $0.1625.
These levels are conditional scenarios. The screenshot alone does not confirm that the price will fall.
📉 6. Volume Analysis
Approximately 155K ON in the displayed volume reading and 26.4K USDT in trading volume.
The volume moving averages are approximately 634K for MA(5) and 752K for MA(10).
Recent volume is lower than these averages, suggesting that trading activity has slowed compared with earlier candles.
A breakout accompanied by increasing volume would generally provide stronger confirmation than a price move on weak volume.
Remember that the latest candle may still be forming, so its volume can change.
⚠️ 7. Risk Management for Futures Traders
$ON USDT is a perpetual futures contract, so leverage can magnify both profits and losses.
For example, a $10 margin position at 10× leverage represents approximately $100 in exposure. A 2% adverse price movement would produce an approximately $2 loss before fees and funding, assuming a linear contract and no intervening position changes.
At higher leverage, a smaller adverse movement can consume a larger proportion of your margin.
Always calculate your potential loss before entering a trade. Use an appropriate stop-loss, avoid risking money you cannot afford to lose, and remember that liquidation can occur when losses consume the available margin.
🔍 8. Final Market Outlook
Based on the 5-minute chart, ONUSDT currently has a cautiously bullish short-term structure.
The price is above the three moving averages, but the market is consolidating near $0.1706, with resistance around $0.1735–$0.1740. 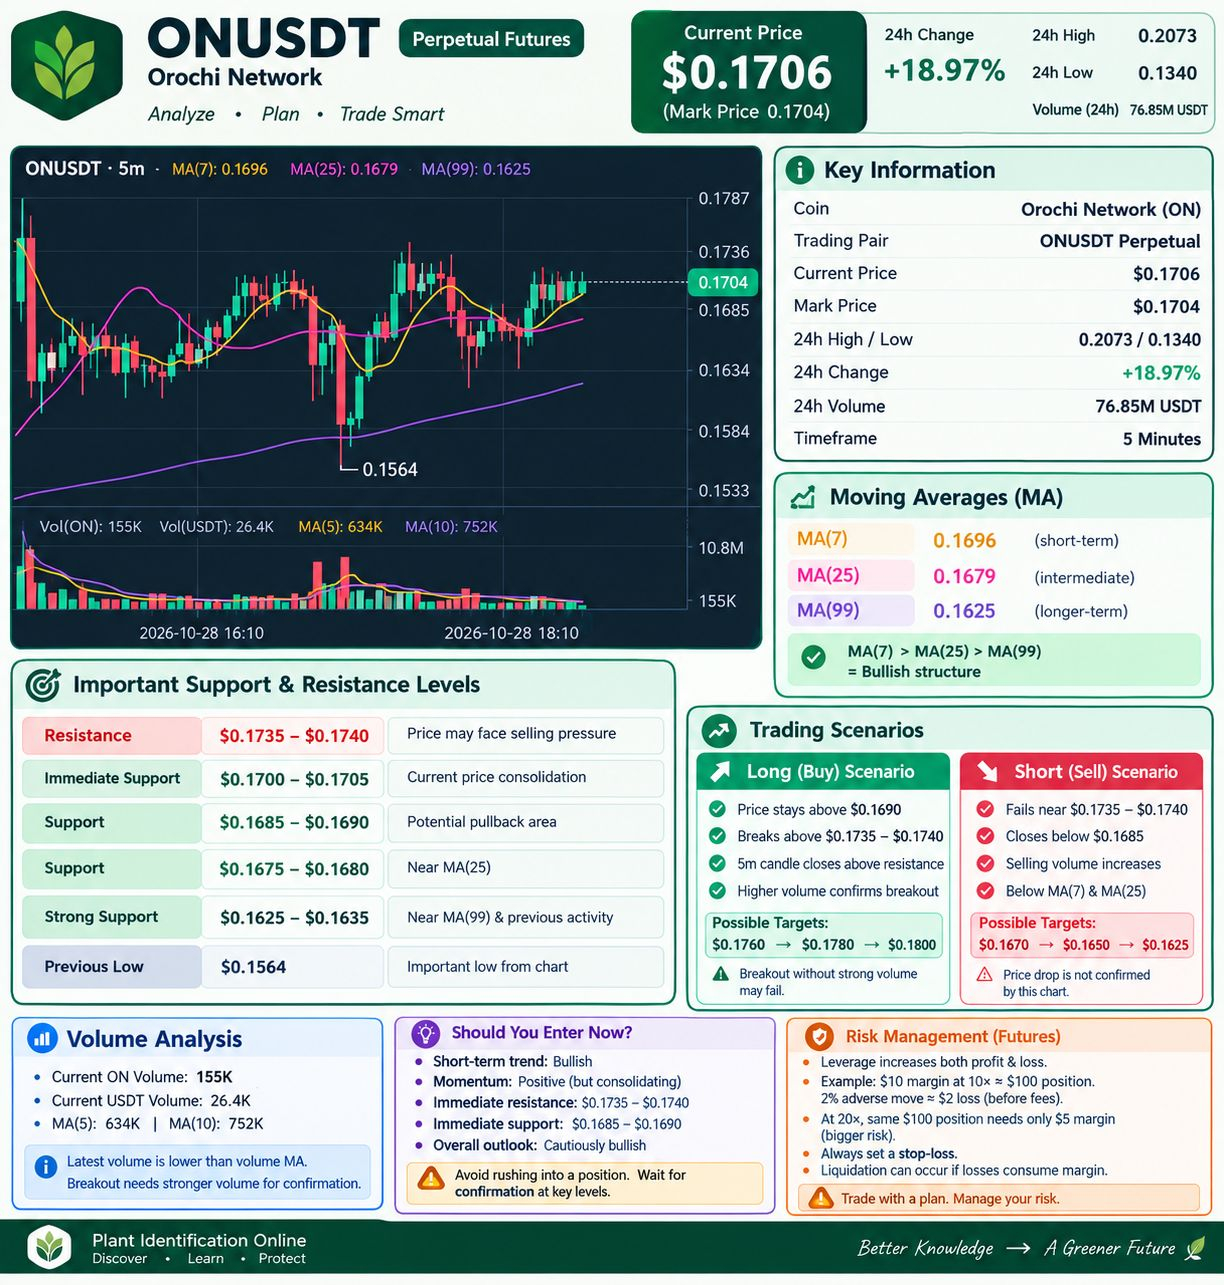 The next important move depends on whether buyers can break resistance or sellers can push the price below support.
My strategy: Avoid chasing the current price. Wait for a confirmed breakout above resistance or a confirmed breakdown below support before considering a trade.
📌 Remember: No technical analysis can guarantee a profitable trade. Always conduct your own research and manage your risk carefully.
#ONUSDT #orochinetwork #CryptoAnalysis #BİNANCEFUTURES #cryptotrading