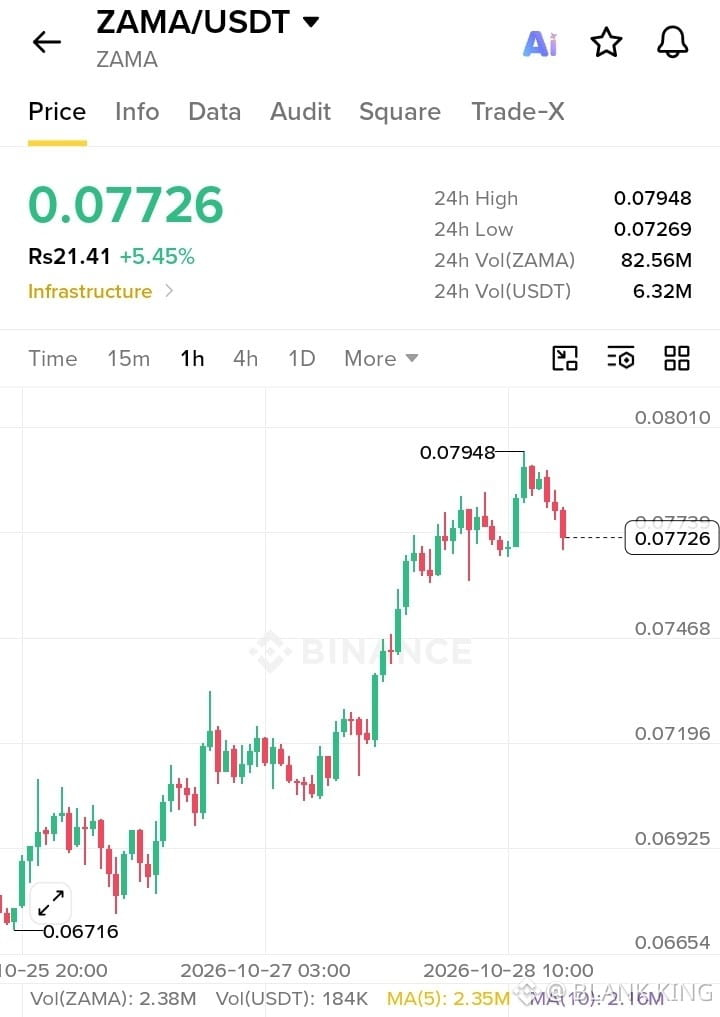
$ZAMA is trading around $0.07726, up 5.45% in the last 24 hours. The chart shows a strong move from $0.06716 toward $0.07948, followed by a small pullback.
What interests me here is whether buyers can defend the recent gains or if the price needs more time to cool down. The $0.07948 area is the key resistance to watch, while $0.07468 could act as nearby support.
Volume is also worth monitoring before making any decisions. No need to chase green candles — let the market confirm its next move.
What interests me here is whether buyers can defend the recent gains or if the price needs more time to cool down. The $0.07948 area is the key resistance to watch, while $0.07468 could act as nearby support.
Volume is also worth monitoring before making any decisions. No need to chase green candles — let the market confirm its next move.