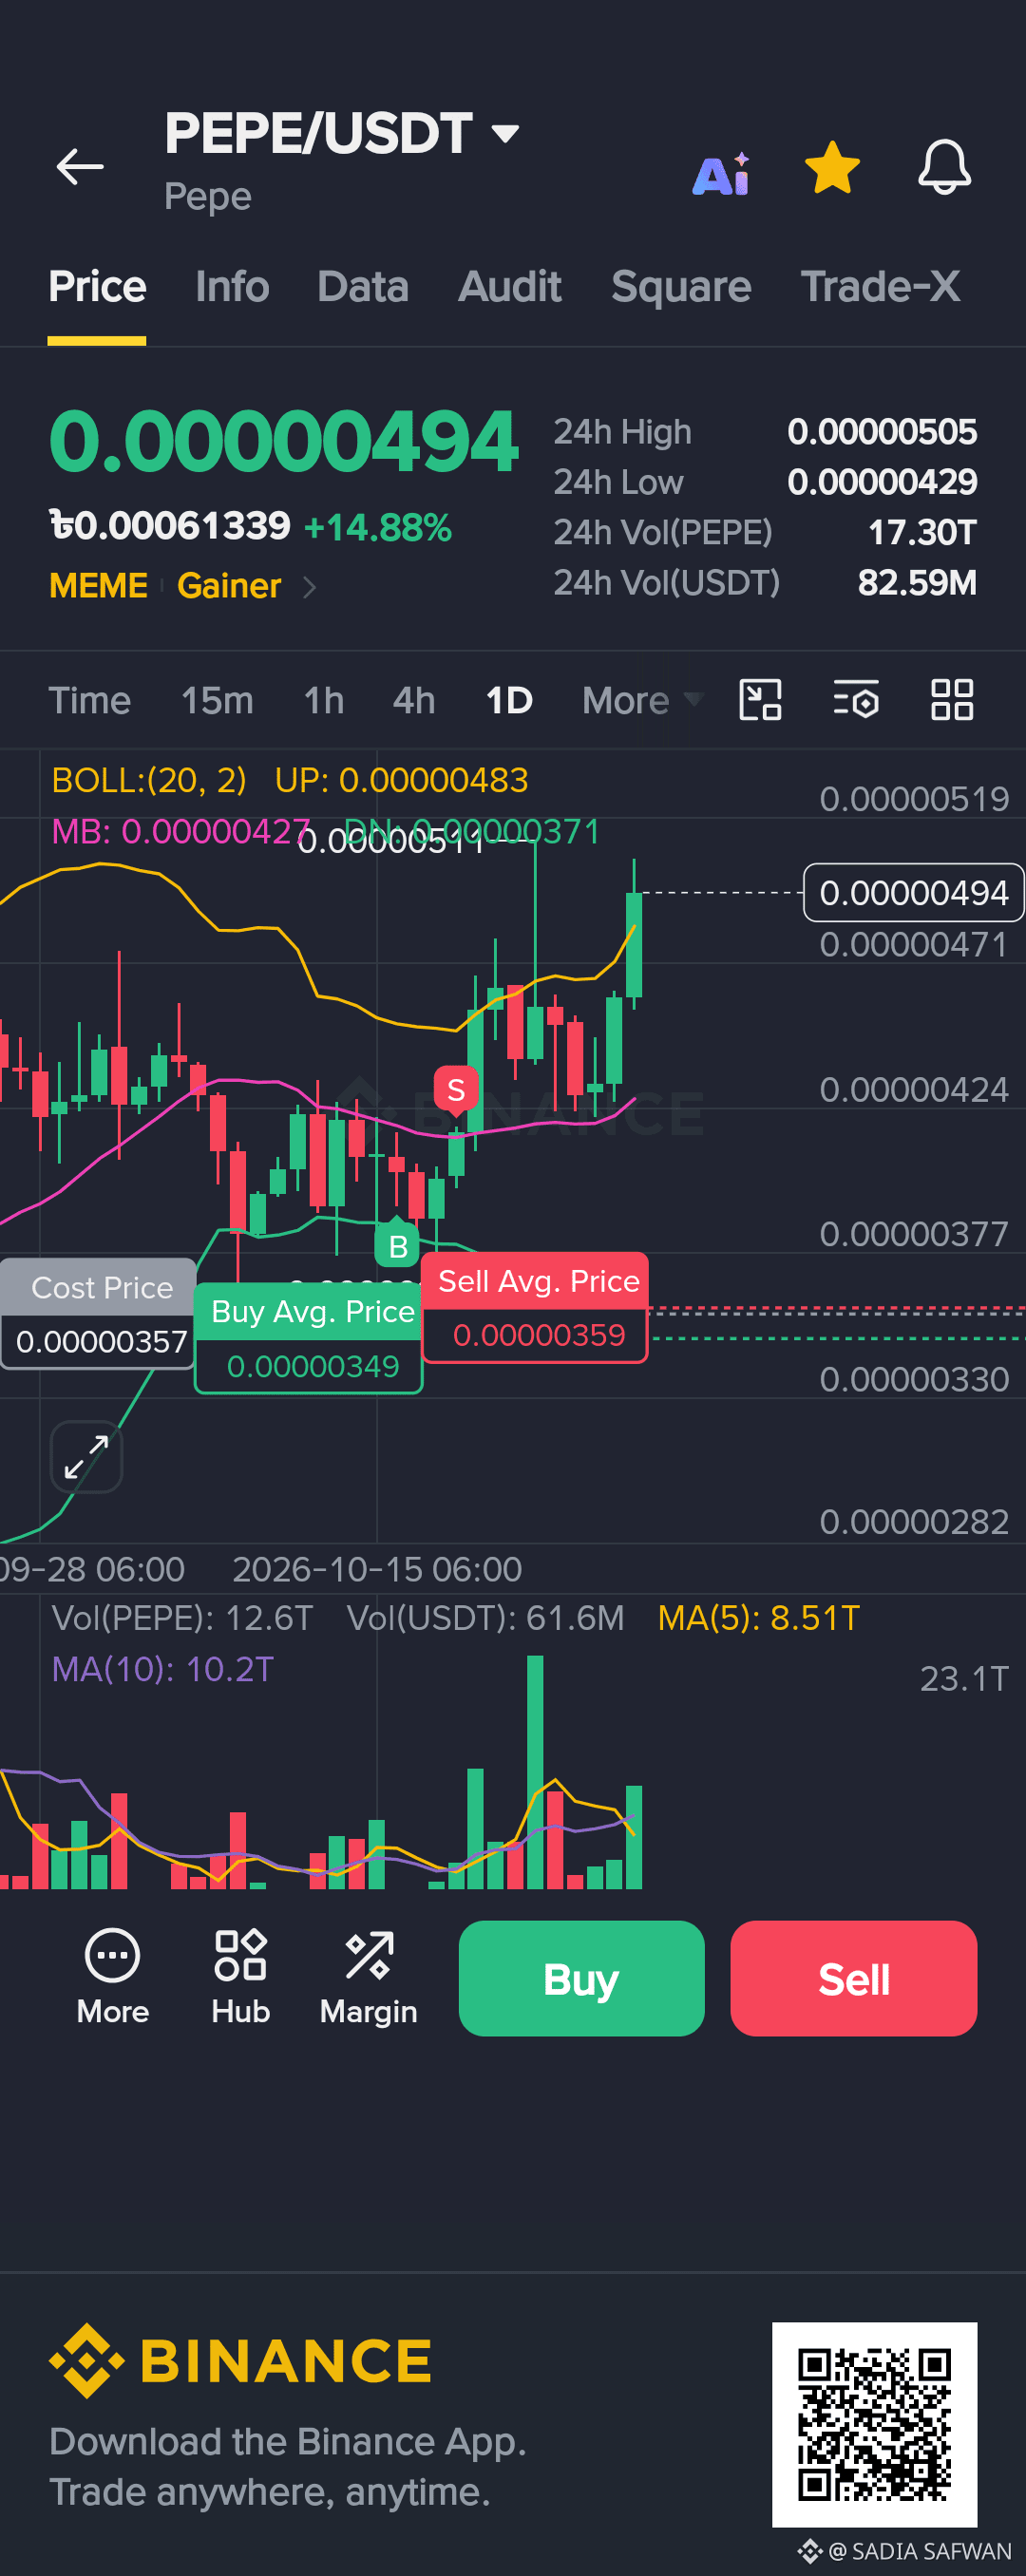
📊 $BTC Market & Price Overview
Current Price: 0.00000494 USDT (+14.88%)
24h High / Low: $BTC 0.00000505 / 0.00000429
24h Volume: 17.30T PEPE / 82.59M USDT
Category/Status: MEME, Gainer
💼 Position & Trade Metrics
Cost Price: 0.00000357
Buy Average Price: 0.0000349 (Note: Appears formatted with standard alignment relative to active execution markers)
Sell Average Price: 0.00000359
Chart Markers:
Green [B] and dashed lines indicate previous buy execution zones around the 0.00000349–0.00000357 region.
Red [S] and dashed lines indicate sell activity/targets around the 0.00000359 region.
📈 Technical Indicators
Timeframe: 1D (Daily Candles)
Bollinger Bands (BOLL: 20, 2):
UP (Upper Band): 0.00000483
MB (Middle Band): 0.00000427
7
Current Action: The price is testing and trading slightly above the upper Bollinger Band (0.00000483), signaling strong bullish momentum or short-term overextension as it pushes toward the upper resistance lines.