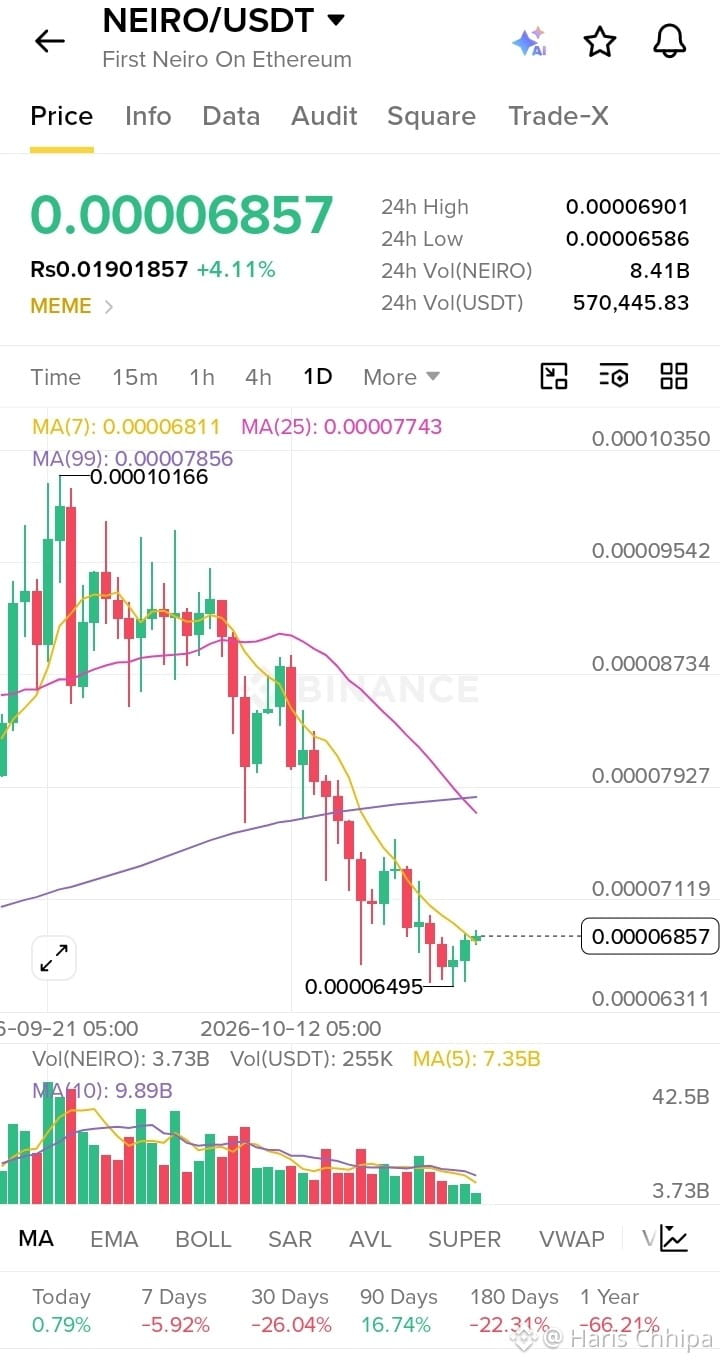
Pair and interval
NEIRO/USDT spot, 4-hour chart (default because no interval was specified). The summary covers 29 completed candles; the latest in-progress candle was excluded.
Observable direction
Downward over the completed 4-hour window: the first candle opened at 0.00007182, while the last completed candle closed at 0.00006837.
Change: −0.00000345 USDT
Percentage change: −4.80%
High and low range
Across the completed 4-hour candles:
High: 0.00007251
Low: 0.00006495
Last completed close: 0.00006837
The last close is about 45.2% above the low of this range, placing it slightly below the midpoint.
Momentum and volume context
The latest 5 completed 4-hour candles had narrower movements than the previous 5:
Average candle range narrowed from approximately 0.000001226 to 0.000001078
Average absolute candle move narrowed from approximately 0.000000572 to 0.000000522
However, trading activity increased:
Average base volume rose from about 867.3 million NEIRO to 1.331 billion NEIRO
Average quote turnover rose from about 57,458 USDT to 90,245 USDT
So, the chart shows a broader decline, with recent price movement becoming calmer while volume and turnover increased.
Caveats
This is based only on the last 30 requested 4-hour candles, a relatively short window. The in-progress candle was excluded, so the latest confirmed reading is the last completed 4-hour close. Raw candles describe past price and volume behavior; they do not establish future direction or provide a buy, sell, or hold signal.