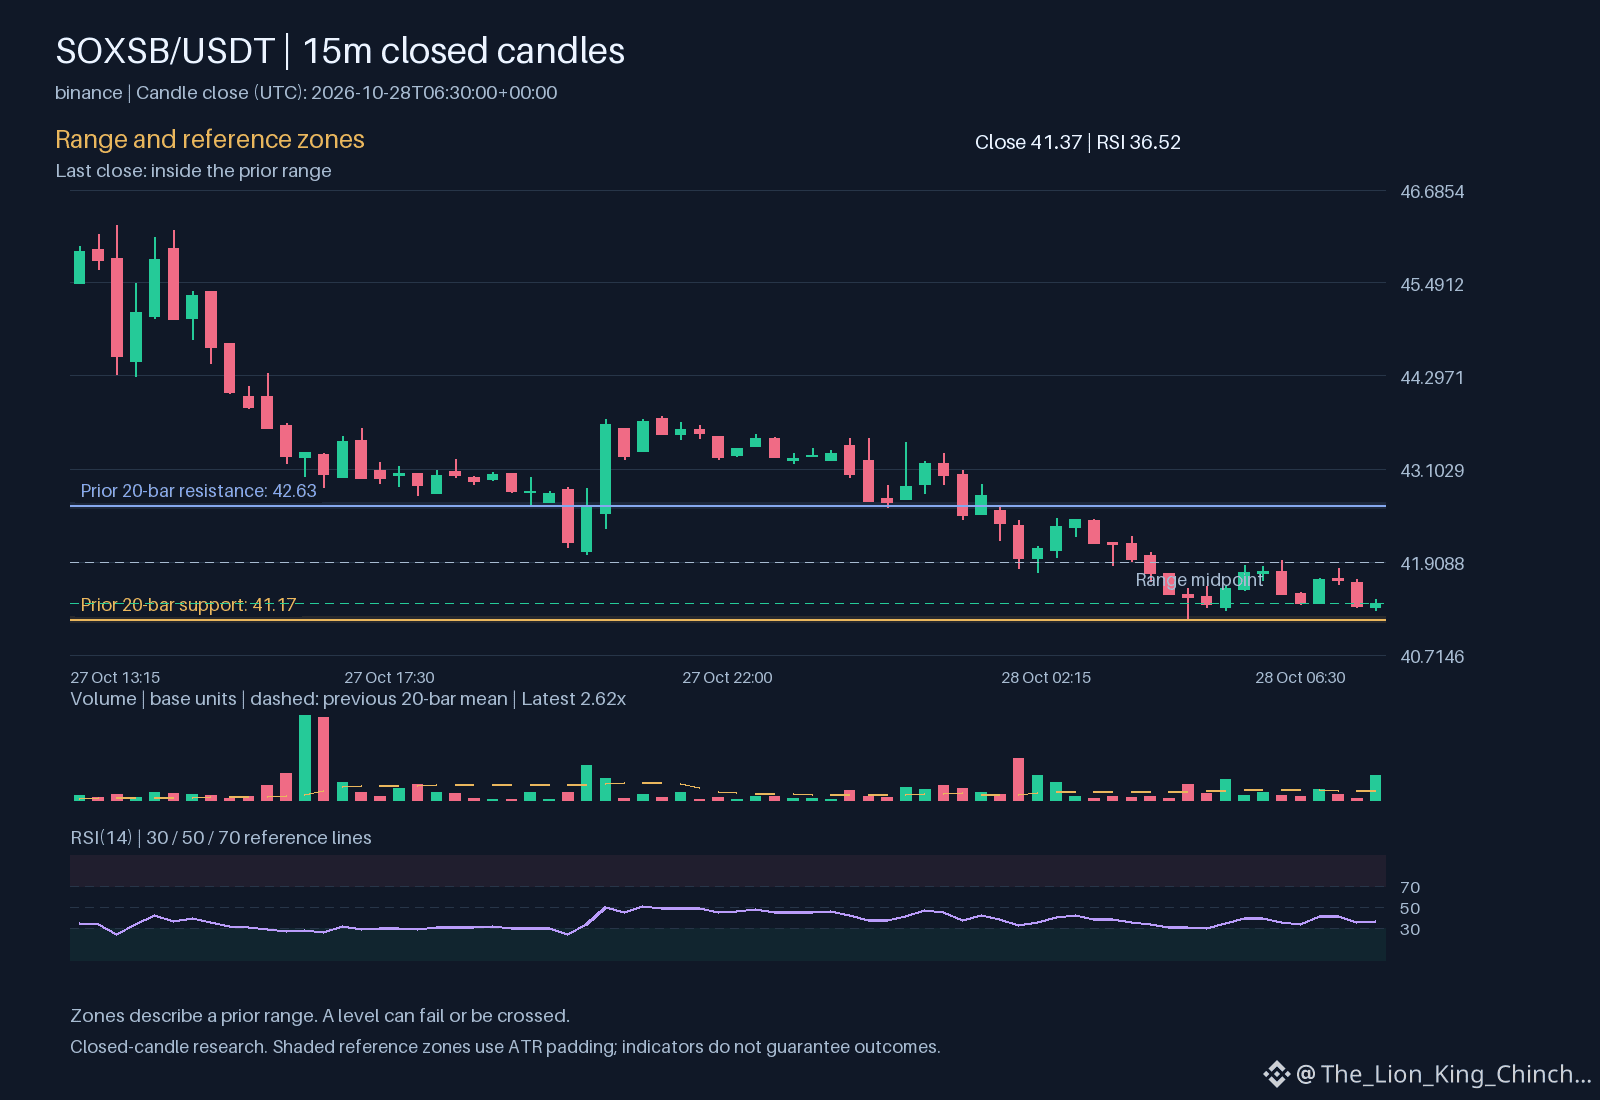
$SOXSB : SOXSB Dynamics and the Anchor Effect
The hourly chart for $SOXSB currently shows a downward move while trading volume stays above its usual baseline. This activity occurs within the established price range. When volume rises during a price drop, it often draws heavy attention. A common mental trap in these moments is anchoring. This happens when a person relies too heavily on the first price they saw or a specific high point from earlier in the session.
Anchoring can change how someone evaluates $SOXSB by making current levels seem like a discount compared to the anchor. If the price is 41.37, an anchored mind might ignore the downward hourly direction because the price is lower than the recent resistance of 42.63. This bias can lead to ignoring the daily change of -15.8633 because the mind is stuck on a past peak.
Instead of looking at the trend objectively, a person might wait for a return to the anchor. To counter this, use a practical self-check: if you did not already know the previous high, would the current RSI of 36.5235 or the relationship between the price and the EMA of 41.8233 suggest a buy or a sell? Removing the historical anchor helps you see the actual strength of the current trend. Reassessing the move without past prices allows for a clearer view of the risk. 📉
Probabilistic market research, not a recommendation or guaranteed return.
Would you keep the same rule after missing a move?
#SOXSB #TradingPsychology #CryptoLearning